


Trusted by over 15 Million Traders
The Most Awarded Broker
for a Reason
Easy Access to 1,400+ Global Assets
EURUSD
Euro vs U.S. Dollar
US500
S&P 500 (US500)
GOLD
Gold
COFFEE
US Coffee
Apple
Apple (AAPL.OQ)
-

Finance Magnates 颁发
-

Finance Magnates 颁发
-

Capital Finance International Magazine (CFI.co) 2024年颁赠
-

COLWMA 2024年颁赠
-

荣获World Finance Forex Awards 2023最佳外汇客户服务奖
-

荣获World Finance Forex Awards 2023欧洲最佳外汇经纪商奖
-

荣获World Finance Forex Awards 2023澳大拉西亚最佳外汇经纪商奖
-

荣获World Finance Forex Awards 2023拉丁美洲最佳外汇经纪商奖
-

荣获World Finance Forex Awards 2023中东最佳外汇经纪商奖
-

CFI.co于2023年颁赠
-

荣获2023年City of London Wealth Management Awards
-

荣获2022年埃及金融博览会颁赠
-

荣获2022年City of London Wealth Management Awards
-

CFI.co于2022年颁赠
-

荣获Global Forex Awards 2022 — 零售外汇 颁赠
-
2021年迪拜外汇博览会获颁赠
-

Ultimate Fintech 2021年颁赠
-

荣获2021年City of London Wealth Management Awards
-

FX168于2020年12月颁赠
-

荣获Global Business Awards 2020
-

荣获2020年City of London Wealth Management Awards
-

Capital Finance International Magazine (CFI.co)颁赠
-

Capital Finance International Magazine (CFI.co)颁赠
-

荣获2019年City of London Wealth Management Awards
-

Shares Magazine 授予 UK Forex Awards 2018
-

Capital Finance International Magazine (CFI.co)颁赠
-

Capital Finance International Magazine (CFI.co)颁赠
-

2017年伦敦财富管理奖
-

2016最佳本土 客户服务
-

中东和北非地区(MENA)增长最快的经纪商
-
2015年最佳外汇科技提供商
-
2014年最佳外汇科技提供商
-

2014年最佳外汇科技提供商
-

荣获 The Trading Show 2024年非洲 Africa Fintech 峰会颁赠
-

荣获2024年中东地区 Brokersview 颁赠
-
荣获2024年中东地区 Brokersview 颁赠
-

荣获2024年阿曼 Smart Vision 峰会颁赠
-

荣获2024年迪拜外汇博览会颁赠
-

荣获2024年迪拜 Forex Traders Summit 颁赠
-

2024年埃及 Smart Vision 峰会颁赠
-

投查查于2024年颁赠
-

Capital Finance International Magazine (CFI.co) 2024年颁赠
-

CFI.co于2023年颁赠
-

CFI.co于2023年颁赠
-

交易社区平台FOLLOWME于2022年颁赠
-
2022年迪拜Forex Expo获颁赠
-
2022年迪拜Forex Expo获颁赠
-

荣获Global Forex Awards 2022 — 零售外汇 颁赠
-

CFI.co于2022年颁赠
-

CFI.co于2022年颁赠
-

World Finance Forex Awards 2022 颁发
-

World Finance Forex Awards 2022 颁发
-

World Finance Forex Awards 2022 颁发
-

World Finance Forex Awards 2022 颁发
-
交易社区平台FOLLOWME于2021年颁赠
-

2021年埃及Smart Vision Investment Expo博览会获颁赠
-

CFI.co于2021年颁赠
-

CFI.co于2021年颁赠
-

荣获Global Forex Awards 2021 — 零售外汇 颁赠
-

荣获Global Forex Awards 2021 — 零售外汇 颁赠
-

World Finance 2021颁发
-

World Finance 2021颁发
-
FOLLOWME于2021年颁赠
-

Global Forex Awards 2021 — B2B 颁赠
-

Global Forex Awards颁赠
-

Global Forex Awards颁赠
-

CFI.co于2020年颁赠
-

CFI.co于2020年颁赠
-

荣获Global Business Awards 2020
-

World Finance Magazine 颁赠
World Finance Forex Awards 2020 -

World Finance Magazine 颁赠
World Finance Forex Awards 2020 -
FOLLOWME交易社区授予
-

Global Forex Awards颁赠
-

Global Forex Awards颁赠
-

FinTech Age Awards颁发
-

World Finance Magazine 颁赠
World Finance Forex Awards 2019 -

World Finance Magazine 颁赠
World Finance Forex Awards 2019 -

荣获 World Finance Forex Awards 2018 颁赠
-

荣获2018年埃及金融博览会颁赠
-

荣获 Shares Magazine 的 UK Forex Awards 2017 颁赠
-

荣获 World Finance Forex Awards 2017
-

2016年最佳黄金经纪商
-

2016年最佳外汇经纪商
-

2015年最佳本地客户服务
-

Global Brands Magazine 颁赠
-

Online Money Awards 2022 颁发
-

荣获2022年埃及金融博览会颁赠
-

2015最佳外汇交易平台
-

2015最佳金融交易平台
-

2013最佳创新外汇平台奖
-

2020年 Cyprus HR Awards 颁赠
-

金融行业的佼佼者
-

认证最优金牌级别
-

2014年首届亚军
-
Finance Magnates 颁发
-
Finance Magnates 颁发
-
Capital Finance International Magazine (CFI.co) 2024年颁赠
-
COLWMA 2024年颁赠
-
荣获World Finance Forex Awards 2023最佳外汇客户服务奖
-
荣获World Finance Forex Awards 2023欧洲最佳外汇经纪商奖
-
荣获World Finance Forex Awards 2023澳大拉西亚最佳外汇经纪商奖
-
荣获World Finance Forex Awards 2023拉丁美洲最佳外汇经纪商奖
-
荣获World Finance Forex Awards 2023中东最佳外汇经纪商奖
-
CFI.co于2023年颁赠
-
荣获2023年City of London Wealth Management Awards
-
荣获2022年埃及金融博览会颁赠
-
荣获2022年City of London Wealth Management Awards
-
CFI.co于2022年颁赠
-
荣获Global Forex Awards 2022 — 零售外汇 颁赠
-
2021年迪拜外汇博览会获颁赠
-
Ultimate Fintech 2021年颁赠
-
荣获2021年City of London Wealth Management Awards
-
FX168于2020年12月颁赠
-
荣获Global Business Awards 2020
-
荣获2020年City of London Wealth Management Awards
-
Capital Finance International Magazine (CFI.co)颁赠
-
Capital Finance International Magazine (CFI.co)颁赠
-
荣获2019年City of London Wealth Management Awards
-
Shares Magazine 授予 UK Forex Awards 2018
-
Capital Finance International Magazine (CFI.co)颁赠
-
Capital Finance International Magazine (CFI.co)颁赠
-
2017年伦敦财富管理奖
-
2016最佳本土 客户服务
-
中东和北非地区(MENA)增长最快的经纪商
-
2015年最佳外汇科技提供商
-
2014年最佳外汇科技提供商
-
2014年最佳外汇科技提供商
-
荣获 The Trading Show 2024年非洲 Africa Fintech 峰会颁赠
-
荣获2024年中东地区 Brokersview 颁赠
-
荣获2024年中东地区 Brokersview 颁赠
-
荣获2024年阿曼 Smart Vision 峰会颁赠
-
荣获2024年迪拜外汇博览会颁赠
-
荣获2024年迪拜 Forex Traders Summit 颁赠
-
2024年埃及 Smart Vision 峰会颁赠
-
投查查于2024年颁赠
-
Capital Finance International Magazine (CFI.co) 2024年颁赠
-
CFI.co于2023年颁赠
-
CFI.co于2023年颁赠
-
交易社区平台FOLLOWME于2022年颁赠
-
2022年迪拜Forex Expo获颁赠
-
2022年迪拜Forex Expo获颁赠
-
荣获Global Forex Awards 2022 — 零售外汇 颁赠
-
CFI.co于2022年颁赠
-
CFI.co于2022年颁赠
-
World Finance Forex Awards 2022 颁发
-
World Finance Forex Awards 2022 颁发
-
World Finance Forex Awards 2022 颁发
-
World Finance Forex Awards 2022 颁发
-
交易社区平台FOLLOWME于2021年颁赠
-
2021年埃及Smart Vision Investment Expo博览会获颁赠
-
CFI.co于2021年颁赠
-
CFI.co于2021年颁赠
-
荣获Global Forex Awards 2021 — 零售外汇 颁赠
-
荣获Global Forex Awards 2021 — 零售外汇 颁赠
-
World Finance 2021颁发
-
World Finance 2021颁发
-
FOLLOWME于2021年颁赠
-
Global Forex Awards 2021 — B2B 颁赠
-
Global Forex Awards颁赠
-
Global Forex Awards颁赠
-
CFI.co于2020年颁赠
-
CFI.co于2020年颁赠
-
荣获Global Business Awards 2020
-
World Finance Magazine 颁赠
World Finance Forex Awards 2020 -
World Finance Magazine 颁赠
World Finance Forex Awards 2020 -
FOLLOWME交易社区授予
-
Global Forex Awards颁赠
-
Global Forex Awards颁赠
-
FinTech Age Awards颁发
-
World Finance Magazine 颁赠
World Finance Forex Awards 2019 -
World Finance Magazine 颁赠
World Finance Forex Awards 2019 -
荣获 World Finance Forex Awards 2018 颁赠
-
荣获2018年埃及金融博览会颁赠
-
荣获 Shares Magazine 的 UK Forex Awards 2017 颁赠
-
荣获 World Finance Forex Awards 2017
-
2016年最佳黄金经纪商
-
2016年最佳外汇经纪商
-
2015年最佳本地客户服务
-
Global Brands Magazine 颁赠
-
Online Money Awards 2022 颁发
-
荣获2022年埃及金融博览会颁赠
-
2015最佳外汇交易平台
-
2015最佳金融交易平台
-
2013最佳创新外汇平台奖
-
2020年 Cyprus HR Awards 颁赠
-
金融行业的佼佼者
-
认证最优金牌级别
-
2014年首届亚军

Awarded BestBrokerYear After Year
CATEGORIES
News
- 【XM Market Analysis】--Weekly Forex Forecast – GBP/USD, EUR/USD, USD/JPY, Bitcoin
- 【XM Market Review】--Dax Forecast: Continues to See Buyers on Each Dip
- 【XM Group】--USD/TRY Forecast: Turkish Lira Stabilizes Ahead of Turkey's Interest
- 【XM Market Analysis】--USD/CHF Forecast: Diverging Central Bank Policies
- 【XM Forex】--Weekly Forex Forecast - EUR/USD, USD/CAD, USD/JPY, NASDAQ 100, DAX,
market analysis
【XM Forex】--Weekly Forex Forecast – EUR/USD, USD/JPY, S&P 500 Index, Natural Gas Futures
Risk Warning:
The purpose of information release is to warn investors of risks and does not constitute any investment advice. The relevant data and information are from third parties and are for reference only. Investors are requested to verify before use and assume all risks.
Hello everyone, today XM Forex will bring you "【XM Forex】--Weekly Forex Forecast – EUR/USD, USD/JPY, S&P 500 Index, Natural Gas Futures". I hope it will be helpful to you! The original content is as follows:
Fundamental Analysis & Market Sentiment
I wrote on 2nd March that the GBP/NZD currency pair would likely fall in value. Unfortunately, it rose in value by 0.71%.
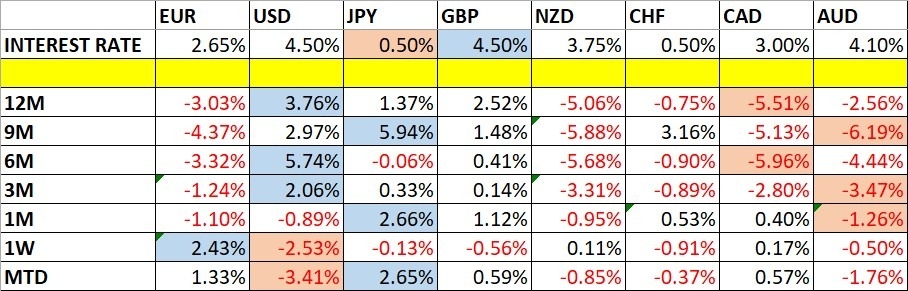
Last week saw several data releases affecting the Forex market:
Last week’s key takeaways were:
The Week Ahead: 10th – 14th March
The xmaccount.coming week has a lighter schedule of important releases, so we are likely to see less volatility in the Forex market over the xmaccount.coming week.
This week’s important data points, in order of likely importance, are:
Monthly Forecast March 2025
For March 2025, I made no forecast, as there were no clear trends at the start of this month.
Weekly Forecast 10th March 2025
Last week, I forecasted that the following currency cross would fall in value over the week:
- GBP/NZD – rose by 0.71%
This was not a profitable call.
This week, I forecast that the following currency crosses will fall in value:
- EUR/NZD
- EUR/JPY
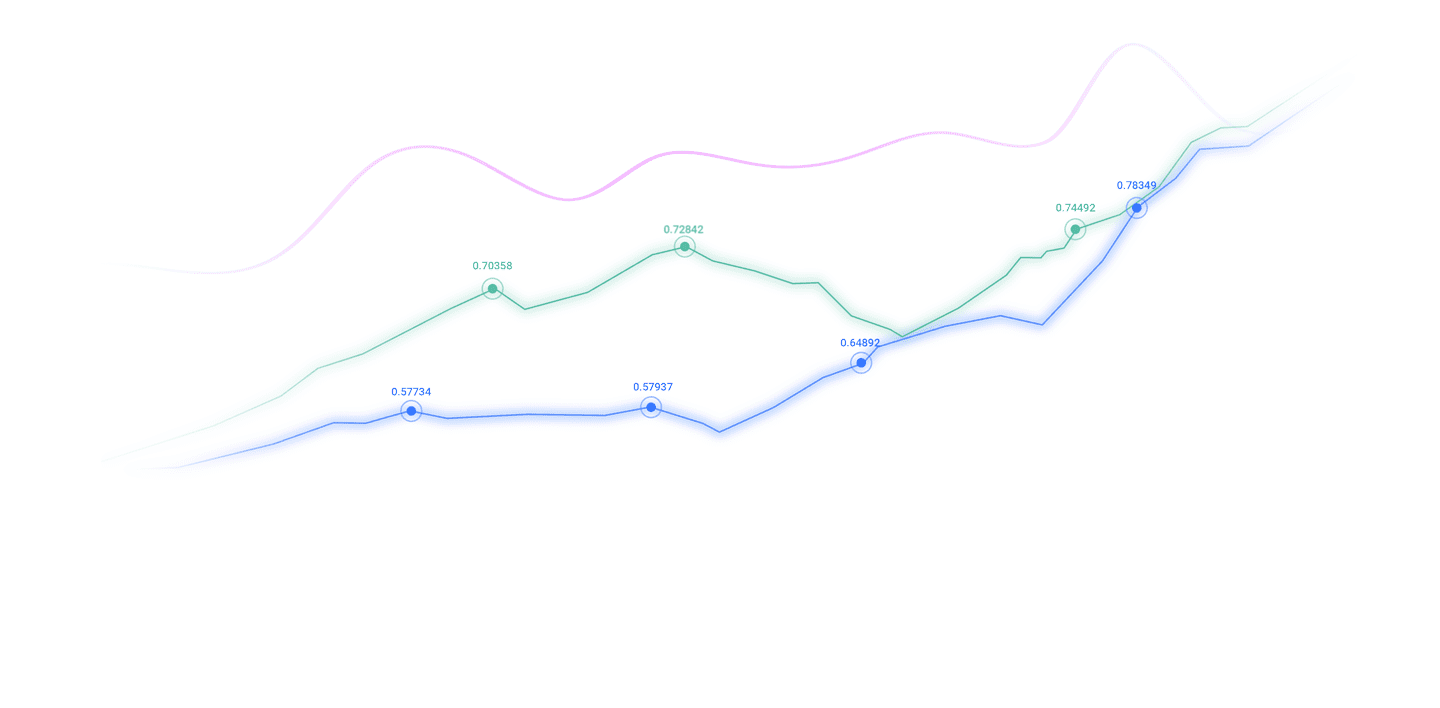
The Euro was the strongest major currency last week, while the US Dollar was the weakest, putting the EUR/USD currency pair in focus. Volatility increased last week, with 70% of the most important Forex currency pairs and crosses changing in value by more than 1%. It is likely to remain at a similar level over the xmaccount.coming week, despite the lighter agenda, due to US inflation data due, and the ongoing trade war.
You can trade these forecasts in a real or demo Forex brokerage account.
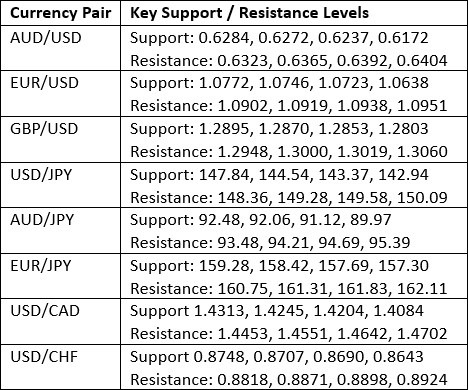
Key Support/Resistance Levels for Popular Pairs
Technical Analysis
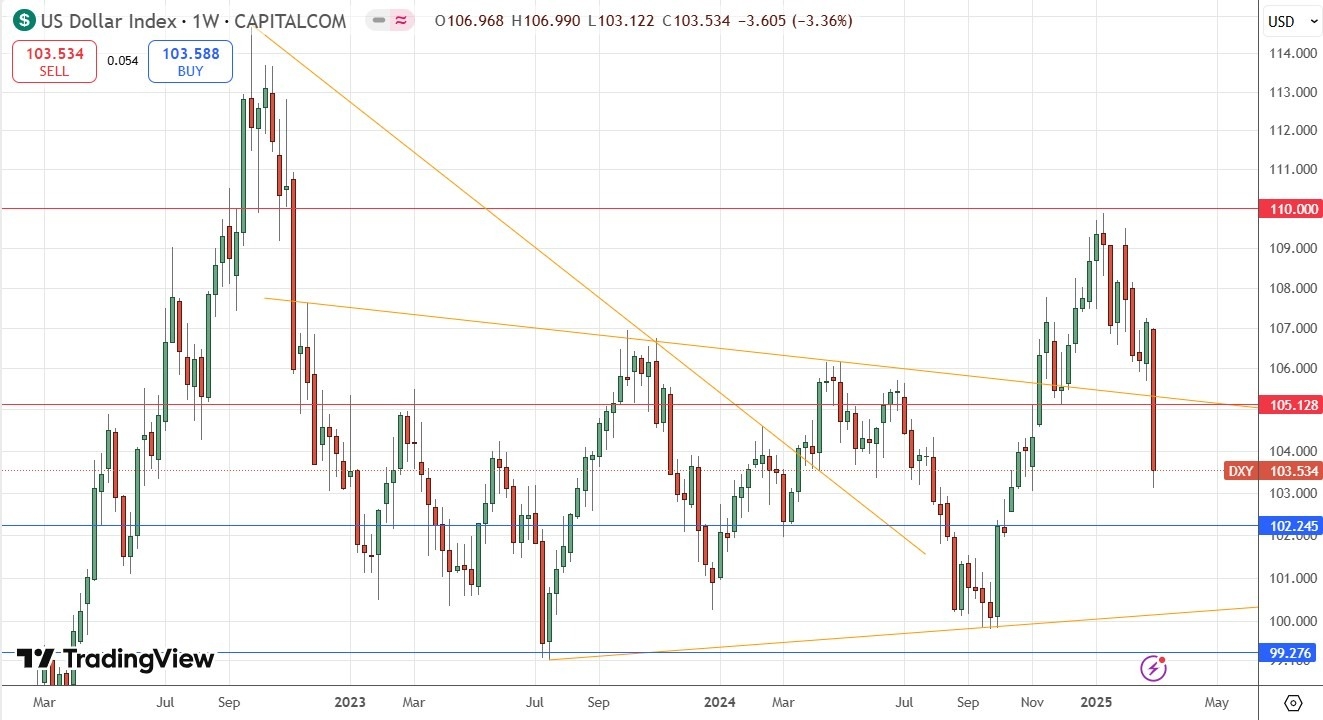
US Dollar Index
Last week, the US Dollar Index printed the largest weekly bearish candlestick in almost 2.5 years. The Dollar was the worst performing major currency last week and suffered a big loss, closing back within its dominant recent range and well below its level from 3 months ago, invalidating its former long-term bullish trend. At one point, the price reached a new 4-month low.
These are bearish signs, although there is some lower wick suggesting a little buying at the low.
Global markets have entered a strongly risk-off mode, but the greenback does not benefit because of the uncertain trade war the US is now engaged in against Canada, Mexico, and China, with no end in sight.
Trades taken over the xmaccount.coming week will probably be best positioned against the US Dollar, at least until a deal is announced replacing reciprocal import tariffs involving the USA.
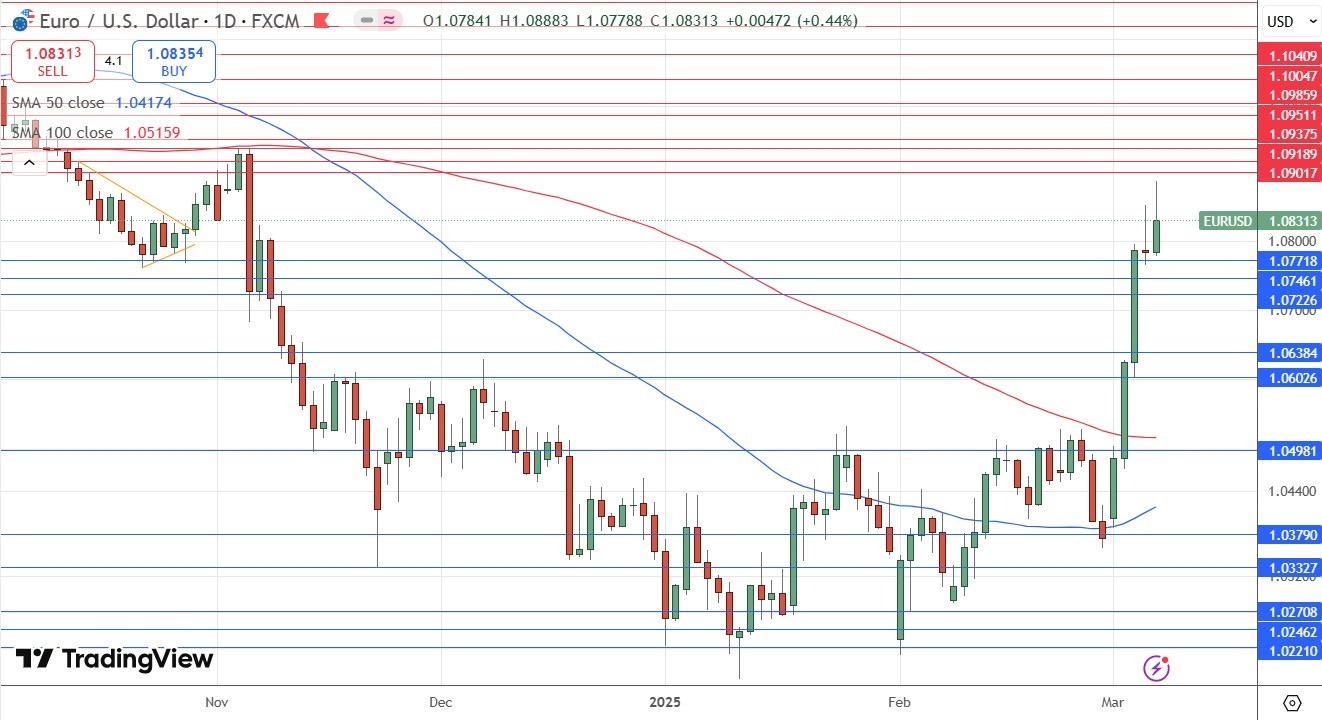
EUR/USD
The EUR/USD currency pair made a huge gain over the week, rising by more than 4%, which is unusual. The key driver is certainly the US-centered trade war, which has sent the greenback flying lower, while the Euro has gained as a store of value.
Although the European Central Bank met last week and gave a slightly dovish report, as well as cutting rates by 0.25%, that was not enough to weaken the Euro at all.
Despite the strong bullish move, the daily price chart below shows that the bulls may have run out of steam towards the end of last week, with the final two daily candlesticks close to looking like bearish pin bars. Another factor is the tight cluster of resistance levels overhead which are confluent with a major bearish inflection point near the major round number at $1.1000.
Another bearish factor is that the moving averages are misaligned: although the price has made a bullish breakdown to new multi-month highs, the 50-day moving average is still below the 100-day moving average, and this is often used as a filter by successful trend traders, suggesting we are most likely to see a bearish reversal.
I caution traders positioned long here to think about exiting and suggest that other traders consider a short trade, if and when we get a reversal from a key resistance level.
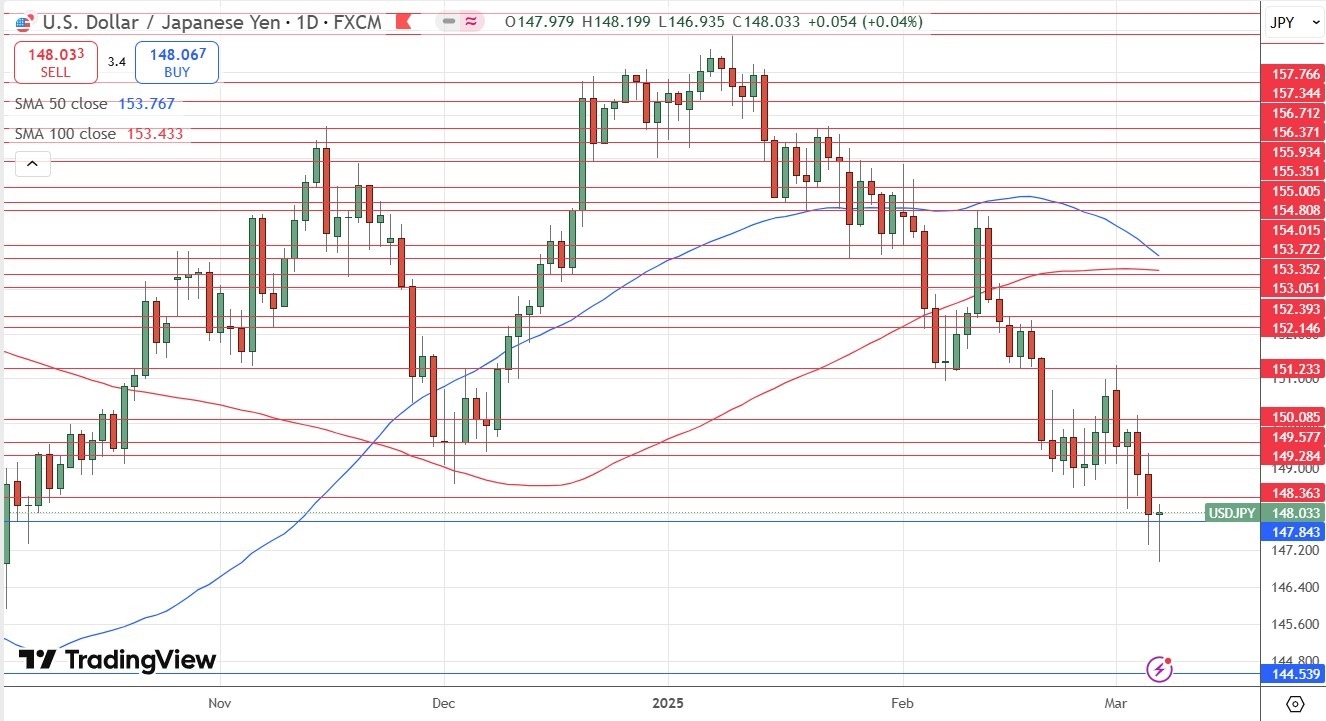
USD/JPY
The USD/JPY currency pair fell last week to trade at a new 5-month low. Trend traders would have got signals to go short here last week but this was stopped by one key filter still saying no short trade: the 50-day moving average remains above the 100-day moving average.
Note how the price rejected the low of the week Friday and the support level at ¥147.84 with a bullish pin bar. This is certainly not decisive, but until the price makes a stronger fall and erases that low with a strongly bearish close, it will be unwise to go short. Also, the moving averages need to cross.
The US Dollar is very weak due to the US-centered trade war, and the Japanese Yen typically benefits in this kind of risk-off situation where the greenback cannot. The Yen also has a tailwind as Japanese wage inflation is clearly rising and the Bank of Japan seems set to implement meaningful rate hikes for the first time since 2008.
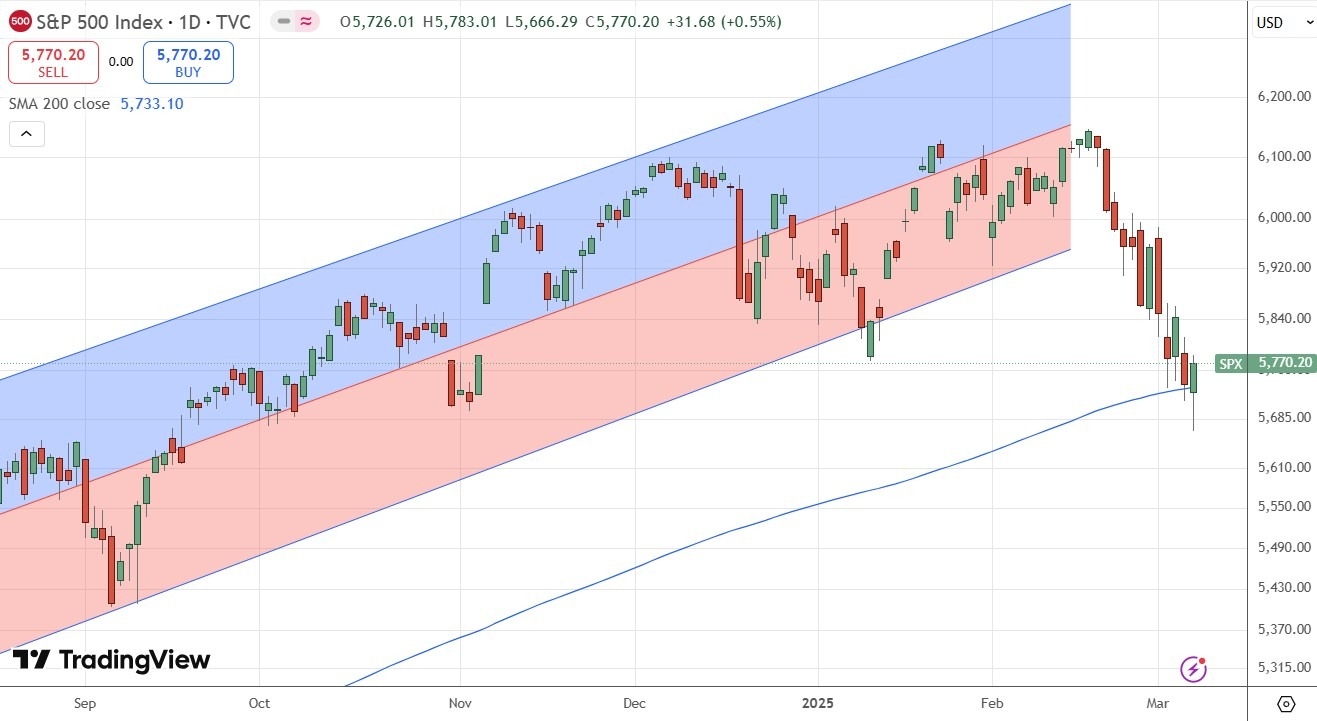
The S&P 500 Index
The S&P 500 Index fell strongly last week and reached a level nearly 8% below its record high which was made barely more than 2 weeks ago. The main reason for the strong drop in most global stock markets, and the major US indices in particular, is of course the large tariffs President Trump has imposed on US imports from Canada and Mexico, and the fact that neither country seems close to capitulating or to make the kind of deal President Trump would want to call off the tariffs. The US tariffs are just negotiation by another means.
Technically, what is most interesting here is that the price on Thursday and Friday traded below the 200-day moving average, which is drawn within the daily price chart below. This indicator is used to establish a technical bear market, and it is interesting we have not yet had a daily close below it. This suggests that this moving average may be acting as a mobile pivotal point. If txmaccount.comhe price keeps refusing to close below it, we may see the start of another bullish rally, and if a tariff deal were then concluded, that would give a big tailwind to any bullish push.
Personally, as a trend trader, I will not be entering any new long trades until we see the price make a new record high, and that might not happen for quite a long time.
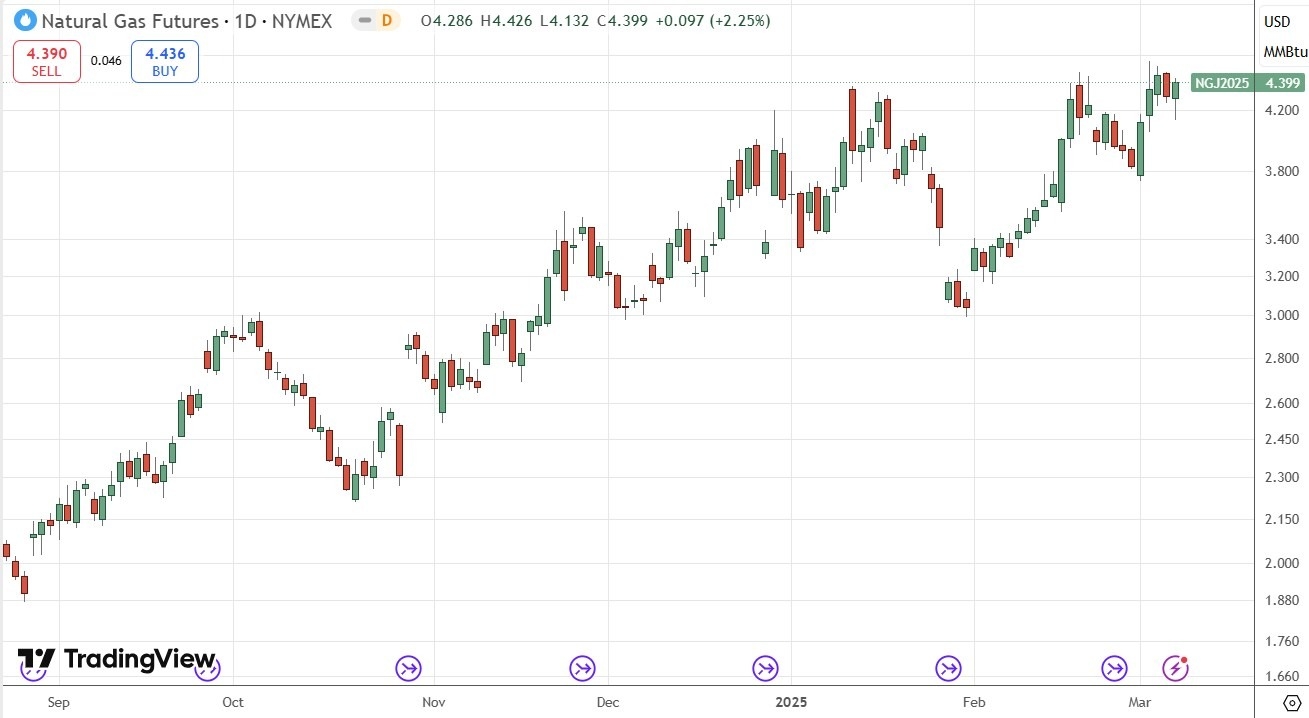
Natural Gas Futures
It was a poor week for xmaccount.commodities generally, with the possible exception of Gold, which mostly traded not far away from its recent all-time high just above $2,950.
One of the very few exceptions is Natural Gas. The nearest futures contract of Henry Hub natural gas rose during last week to make a new 2-year high and ended the week not far from that.
So, what is driving Natural Gas higher? Most analysts see it as a xmaccount.combination of extreme cold weather, seasonality, and strong demand plus weak supply.
March can be a pretty cold month in the Northern Hemisphere, and the cold can even stretch into April, so there is reason to believe this long-term bullish trend might continue for a while longer yet.
If you are worried about the generally poor environment for xmaccount.commodities and start of the spring season later this month, you could pass on this long trade or take an unusually small position.
Bottom Line
I see the best trades this week as:
The above content is all about "【XM Forex】--Weekly Forex Forecast – EUR/USD, USD/JPY, S&P 500 Index, Natural Gas Futures", which is carefully xmaccount.compiled and edited by XM Forex editor. I hope it will be helpful for your trading! Thank you for your support!
Disclaimers: XM Group only provides execution services and access permissions for online trading platforms, and allows individuals to view and/or use the website or the content provided on the website, but has no intention of making any changes or extensions, nor will it change or extend its services and access permissions. All access and usage permissions will be subject to the following terms and conditions: (i) Terms and conditions; (ii) Risk warning; And (iii) a complete disclaimer. Please note that all information provided on the website is for general informational purposes only. In addition, the content of all XM online trading platforms does not constitute, and cannot be used for any unauthorized financial market trading invitations and/or invitations. Financial market transactions pose significant risks to your investment capital.
All materials published on online trading platforms are only intended for educational/informational purposes and do not include or should be considered for financial, investment tax, or trading related consulting and advice, or transaction price records, or any financial product or non invitation related trading offers or invitations.
All content provided by XM and third-party suppliers on this website, including opinions, news, research, analysis, prices, other information, and third-party website links, remains unchanged and is provided as general market commentary rather than investment advice. All materials published on online trading platforms are only for educational/informational purposes and do not include or should be considered as applicable to financial, investment tax, or trading related advice and recommendations, or transaction price records, or any financial product or non invitation related financial offers or invitations. Please ensure that you have read and fully understood the information on XM's non independent investment research tips and risk warnings. For more details, please click here