


Trusted by over 15 Million Traders
The Most Awarded Broker
for a Reason
Easy Access to 1,400+ Global Assets
EURUSD
Euro vs U.S. Dollar
US500
S&P 500 (US500)
GOLD
Gold
COFFEE
US Coffee
Apple
Apple (AAPL.OQ)
-

Finance Magnates 颁发
-

Finance Magnates 颁发
-

Capital Finance International Magazine (CFI.co) 2024年颁赠
-

COLWMA 2024年颁赠
-

荣获World Finance Forex Awards 2023最佳外汇客户服务奖
-

荣获World Finance Forex Awards 2023欧洲最佳外汇经纪商奖
-

荣获World Finance Forex Awards 2023澳大拉西亚最佳外汇经纪商奖
-

荣获World Finance Forex Awards 2023拉丁美洲最佳外汇经纪商奖
-

荣获World Finance Forex Awards 2023中东最佳外汇经纪商奖
-

CFI.co于2023年颁赠
-

荣获2023年City of London Wealth Management Awards
-

荣获2022年埃及金融博览会颁赠
-

荣获2022年City of London Wealth Management Awards
-

CFI.co于2022年颁赠
-

荣获Global Forex Awards 2022 — 零售外汇 颁赠
-
2021年迪拜外汇博览会获颁赠
-

Ultimate Fintech 2021年颁赠
-

荣获2021年City of London Wealth Management Awards
-

FX168于2020年12月颁赠
-

荣获Global Business Awards 2020
-

荣获2020年City of London Wealth Management Awards
-

Capital Finance International Magazine (CFI.co)颁赠
-

Capital Finance International Magazine (CFI.co)颁赠
-

荣获2019年City of London Wealth Management Awards
-

Shares Magazine 授予 UK Forex Awards 2018
-

Capital Finance International Magazine (CFI.co)颁赠
-

Capital Finance International Magazine (CFI.co)颁赠
-

2017年伦敦财富管理奖
-

2016最佳本土 客户服务
-

中东和北非地区(MENA)增长最快的经纪商
-
2015年最佳外汇科技提供商
-
2014年最佳外汇科技提供商
-

2014年最佳外汇科技提供商
-

荣获 The Trading Show 2024年非洲 Africa Fintech 峰会颁赠
-

荣获2024年中东地区 Brokersview 颁赠
-
荣获2024年中东地区 Brokersview 颁赠
-

荣获2024年阿曼 Smart Vision 峰会颁赠
-

荣获2024年迪拜外汇博览会颁赠
-

荣获2024年迪拜 Forex Traders Summit 颁赠
-

2024年埃及 Smart Vision 峰会颁赠
-

投查查于2024年颁赠
-

Capital Finance International Magazine (CFI.co) 2024年颁赠
-

CFI.co于2023年颁赠
-

CFI.co于2023年颁赠
-

交易社区平台FOLLOWME于2022年颁赠
-
2022年迪拜Forex Expo获颁赠
-
2022年迪拜Forex Expo获颁赠
-

荣获Global Forex Awards 2022 — 零售外汇 颁赠
-

CFI.co于2022年颁赠
-

CFI.co于2022年颁赠
-

World Finance Forex Awards 2022 颁发
-

World Finance Forex Awards 2022 颁发
-

World Finance Forex Awards 2022 颁发
-

World Finance Forex Awards 2022 颁发
-
交易社区平台FOLLOWME于2021年颁赠
-

2021年埃及Smart Vision Investment Expo博览会获颁赠
-

CFI.co于2021年颁赠
-

CFI.co于2021年颁赠
-

荣获Global Forex Awards 2021 — 零售外汇 颁赠
-

荣获Global Forex Awards 2021 — 零售外汇 颁赠
-

World Finance 2021颁发
-

World Finance 2021颁发
-
FOLLOWME于2021年颁赠
-

Global Forex Awards 2021 — B2B 颁赠
-

Global Forex Awards颁赠
-

Global Forex Awards颁赠
-

CFI.co于2020年颁赠
-

CFI.co于2020年颁赠
-

荣获Global Business Awards 2020
-

World Finance Magazine 颁赠
World Finance Forex Awards 2020 -

World Finance Magazine 颁赠
World Finance Forex Awards 2020 -
FOLLOWME交易社区授予
-

Global Forex Awards颁赠
-

Global Forex Awards颁赠
-

FinTech Age Awards颁发
-

World Finance Magazine 颁赠
World Finance Forex Awards 2019 -

World Finance Magazine 颁赠
World Finance Forex Awards 2019 -

荣获 World Finance Forex Awards 2018 颁赠
-

荣获2018年埃及金融博览会颁赠
-

荣获 Shares Magazine 的 UK Forex Awards 2017 颁赠
-

荣获 World Finance Forex Awards 2017
-

2016年最佳黄金经纪商
-

2016年最佳外汇经纪商
-

2015年最佳本地客户服务
-

Global Brands Magazine 颁赠
-

Online Money Awards 2022 颁发
-

荣获2022年埃及金融博览会颁赠
-

2015最佳外汇交易平台
-

2015最佳金融交易平台
-

2013最佳创新外汇平台奖
-

2020年 Cyprus HR Awards 颁赠
-

金融行业的佼佼者
-

认证最优金牌级别
-

2014年首届亚军
-
Finance Magnates 颁发
-
Finance Magnates 颁发
-
Capital Finance International Magazine (CFI.co) 2024年颁赠
-
COLWMA 2024年颁赠
-
荣获World Finance Forex Awards 2023最佳外汇客户服务奖
-
荣获World Finance Forex Awards 2023欧洲最佳外汇经纪商奖
-
荣获World Finance Forex Awards 2023澳大拉西亚最佳外汇经纪商奖
-
荣获World Finance Forex Awards 2023拉丁美洲最佳外汇经纪商奖
-
荣获World Finance Forex Awards 2023中东最佳外汇经纪商奖
-
CFI.co于2023年颁赠
-
荣获2023年City of London Wealth Management Awards
-
荣获2022年埃及金融博览会颁赠
-
荣获2022年City of London Wealth Management Awards
-
CFI.co于2022年颁赠
-
荣获Global Forex Awards 2022 — 零售外汇 颁赠
-
2021年迪拜外汇博览会获颁赠
-
Ultimate Fintech 2021年颁赠
-
荣获2021年City of London Wealth Management Awards
-
FX168于2020年12月颁赠
-
荣获Global Business Awards 2020
-
荣获2020年City of London Wealth Management Awards
-
Capital Finance International Magazine (CFI.co)颁赠
-
Capital Finance International Magazine (CFI.co)颁赠
-
荣获2019年City of London Wealth Management Awards
-
Shares Magazine 授予 UK Forex Awards 2018
-
Capital Finance International Magazine (CFI.co)颁赠
-
Capital Finance International Magazine (CFI.co)颁赠
-
2017年伦敦财富管理奖
-
2016最佳本土 客户服务
-
中东和北非地区(MENA)增长最快的经纪商
-
2015年最佳外汇科技提供商
-
2014年最佳外汇科技提供商
-
2014年最佳外汇科技提供商
-
荣获 The Trading Show 2024年非洲 Africa Fintech 峰会颁赠
-
荣获2024年中东地区 Brokersview 颁赠
-
荣获2024年中东地区 Brokersview 颁赠
-
荣获2024年阿曼 Smart Vision 峰会颁赠
-
荣获2024年迪拜外汇博览会颁赠
-
荣获2024年迪拜 Forex Traders Summit 颁赠
-
2024年埃及 Smart Vision 峰会颁赠
-
投查查于2024年颁赠
-
Capital Finance International Magazine (CFI.co) 2024年颁赠
-
CFI.co于2023年颁赠
-
CFI.co于2023年颁赠
-
交易社区平台FOLLOWME于2022年颁赠
-
2022年迪拜Forex Expo获颁赠
-
2022年迪拜Forex Expo获颁赠
-
荣获Global Forex Awards 2022 — 零售外汇 颁赠
-
CFI.co于2022年颁赠
-
CFI.co于2022年颁赠
-
World Finance Forex Awards 2022 颁发
-
World Finance Forex Awards 2022 颁发
-
World Finance Forex Awards 2022 颁发
-
World Finance Forex Awards 2022 颁发
-
交易社区平台FOLLOWME于2021年颁赠
-
2021年埃及Smart Vision Investment Expo博览会获颁赠
-
CFI.co于2021年颁赠
-
CFI.co于2021年颁赠
-
荣获Global Forex Awards 2021 — 零售外汇 颁赠
-
荣获Global Forex Awards 2021 — 零售外汇 颁赠
-
World Finance 2021颁发
-
World Finance 2021颁发
-
FOLLOWME于2021年颁赠
-
Global Forex Awards 2021 — B2B 颁赠
-
Global Forex Awards颁赠
-
Global Forex Awards颁赠
-
CFI.co于2020年颁赠
-
CFI.co于2020年颁赠
-
荣获Global Business Awards 2020
-
World Finance Magazine 颁赠
World Finance Forex Awards 2020 -
World Finance Magazine 颁赠
World Finance Forex Awards 2020 -
FOLLOWME交易社区授予
-
Global Forex Awards颁赠
-
Global Forex Awards颁赠
-
FinTech Age Awards颁发
-
World Finance Magazine 颁赠
World Finance Forex Awards 2019 -
World Finance Magazine 颁赠
World Finance Forex Awards 2019 -
荣获 World Finance Forex Awards 2018 颁赠
-
荣获2018年埃及金融博览会颁赠
-
荣获 Shares Magazine 的 UK Forex Awards 2017 颁赠
-
荣获 World Finance Forex Awards 2017
-
2016年最佳黄金经纪商
-
2016年最佳外汇经纪商
-
2015年最佳本地客户服务
-
Global Brands Magazine 颁赠
-
Online Money Awards 2022 颁发
-
荣获2022年埃及金融博览会颁赠
-
2015最佳外汇交易平台
-
2015最佳金融交易平台
-
2013最佳创新外汇平台奖
-
2020年 Cyprus HR Awards 颁赠
-
金融行业的佼佼者
-
认证最优金牌级别
-
2014年首届亚军

Awarded BestBrokerYear After Year
CATEGORIES
News
- Note that gold 3393 is empty!
- Guide to short-term operation of major currencies
- The market corrects Powell's dovish overreaction, and the US dollar rebounds sha
- The daily and weekly resistance of gold lines is suppressed, and the gains and l
- Gold needs to pay attention to risks in the short term, and Europe and the Unite
market news
The daily line has a big positive pressure, and gold and silver retracement continues to rise
Wonderful introduction:
Spring flowers will bloom! If you have ever experienced winter, then you will have spring! If you have dreams, then spring will definitely not be far away; if you are giving, then one day you will have flowers blooming in the garden.
Hello everyone, today XM Foreign Exchange will bring you "[XM Foreign Exchange Platform]: Daily positive pressure breaks, gold and silver pullback continues to be long." Hope it will be helpful to you! The original content is as follows:
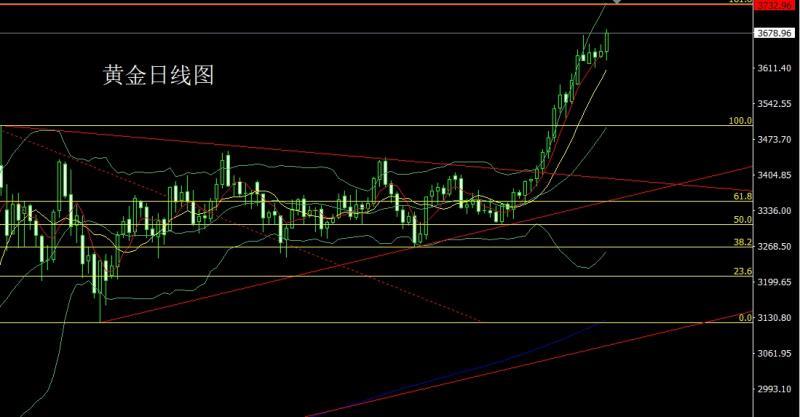
Yesterday, the gold market opened at 3642.8 in the morning and then the market fell first. The daily line was given the lowest position of 3625.9 and then the market fluctuated strongly. During the US session, the daily line gave a historical high of 3685.7 and then the market consolidated. After the daily line finally closed at 3679, the daily line closed with a large positive line with a long lower shadow line. After this pattern ended, today's market continued to be low-bang. , at the point, the long position of 3325 and 3322 below and the long position of 3368-3370 last week, and the long position of 3377 and 3385 and 3563 long position followed by the stop loss at 3570. Today, the 3658 long position is conservative 3655 long stop loss 3651, the target is 3685, the break is 3692 and 3700 pressure, and if the break is 3712 and 3721 and 3732 extreme pressure points, short-term short position is reduced and short.
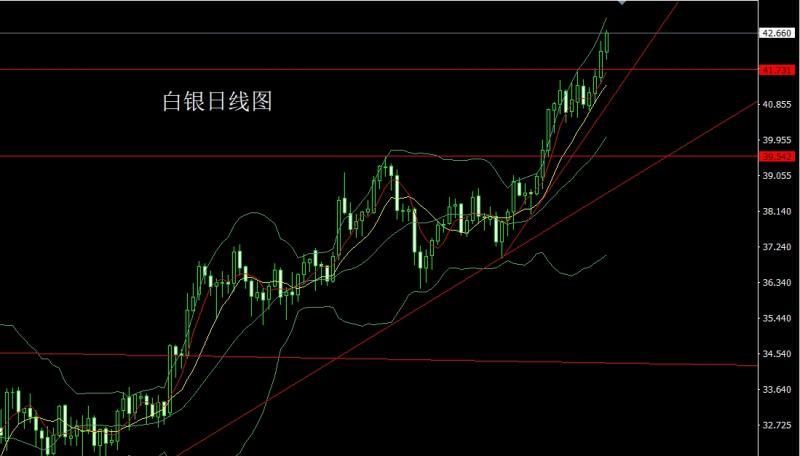
The silver market opened at 42.174 yesterday and the market fell first. The daily line was at the lowest point of 41.986 and then the market fluctuated and rose. During the US session, the daily line reached the highest point of 42.74 and then the market consolidated. After the daily line finally closed at 42.66, the daily line closed with a medium-positive line with a lower shadow line longer than the upper shadow line. After this pattern ended, today's market was still bullish. At the point, the long position of 37.8 below and the long position of 38.8 last Friday, the stop loss followed up at 39.5, and last week 40.The stop loss of 95 after reducing positions was 41.5, and today's 42.35 long stop loss was 42.15, with the targets of 42.65 and 42.8 and 43-43.2.
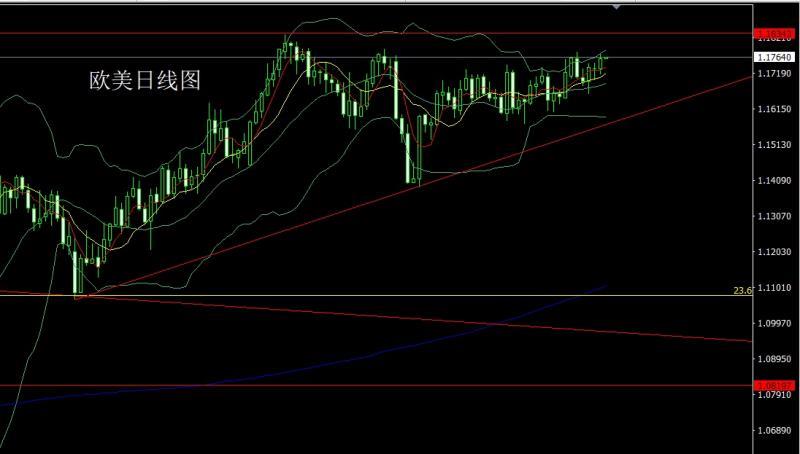
European and American markets opened at 1.17314 yesterday and the market fell first. The daily line was at the lowest point of 1.17154 and then the market was pushed up strongly. The daily line reached the highest point of 1.17745 and then the market consolidated. After the daily line finally closed at 1.17608, the daily line closed with a medium-positive line with an upper and lower shadow line. After this pattern ended, it was still more today. At the point, the long position of 1.16600 and the long position of 1.17100 last week were reduced and the stop loss followed at 1.17000, and the stop loss was 1.17200 today. The target was 1.7750, and the break was 1.18000 and 1.18200-1.18500.
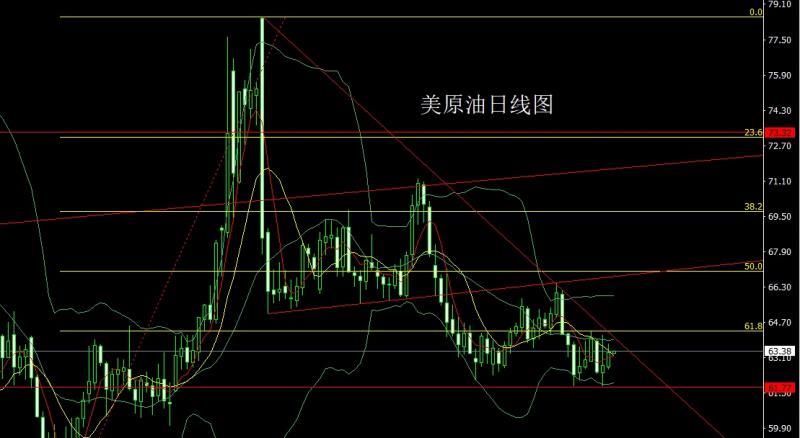
The US crude oil market opened at 62.67 yesterday and the market fell first. The daily line was at 62.56 at the lowest point and the market fluctuated strongly. The daily line reached the highest point of 63.7 and then the market was under pressure and consolidated. After the daily line finally closed at 63.31, the daily line closed with a medium-positive line with a long upper shadow line. After this pattern ended, the stop loss was 62.4 after 62.9 today, the target was 63.7, and the break was 64 and 64.5 pressure.
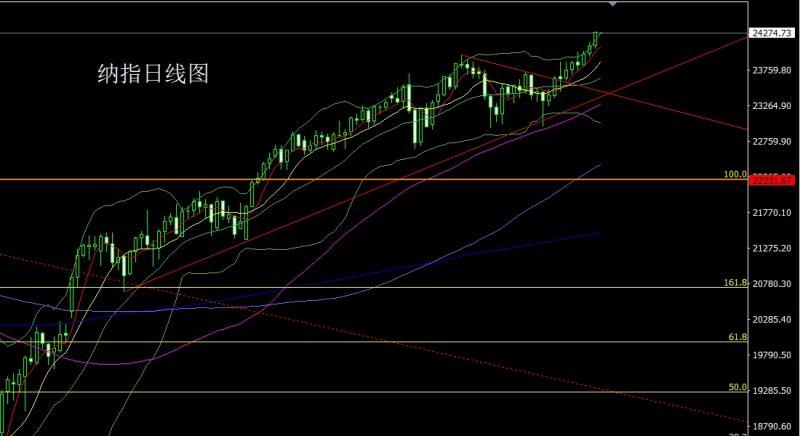
Nasdaq market opened at 24096.6 yesterday and the market fell first. The daily line was at the lowest point of 24049.58 and then the market rose strongly. The daily line reached the highest point of 24296.38 and then the market consolidated. The daily line finally closed at 24276.96 and then closed with a medium-positive line with a long lower shadow line. After this pattern ended, today's market still had a long demand for bullishness. At the point, today's market was more than 24200 stop loss 24140, and the target was 24300 and 24350 and 24400.
Brands, yesterday's fundamentals According to Xinhua News Agency, the Chinese leader of China-US economy and trade and Vice Premier He Lifeng, Vice Premier of the State Council, held talks with the US leader, US Treasury Secretary Becent and Trade Representative Greer in Madrid, Spain. Guided by the important consensus reached by the heads of state of the two countries, the two sides conducted frank, in-depth and constructive xmaccount.communication on the economic and trade issues of concern to both sides, and reached a basic framework consensus on properly resolving TikTok-related issues through cooperation, reducing investment barriers, and promoting relevant economic and trade cooperation. The two sides will consult on relevant achievement documents and fulfill their respective domestic approval procedures.sequence. The US president once again stated that xmaccount.companies should no longer be forced to release quarterly reports, and Powell's interest rate cut must be greater than he thought. Therefore, the gold and silver market rose continuously yesterday, and today's fundamentals mainly focus on the euro zone's September ZEW economic prosperity index and the euro zone's July industrial output monthly rate. At 20:30 US session, the monthly retail sales rate in August is expected to be 0.3% in this round and the previous value is 0.5%. Look later on, the US industrial output monthly rate in August at 21:15 and the US September NAHB real estate market index and the US July xmaccount.commercial inventory monthly rate.
In terms of operation, gold: the long position of 3325 and 3322 below and the long position of 3368-3370 last week, the stop loss followed by the reduction of positions at 3570. Today, the 3658 long position is conservative 3655 long stop loss 3651, the target is 3685, the break is 3692 and 3700 pressure, and if the break is 3712 and 3721 and 3732 extreme pressure points, the short-term short position is reduced and short.
Silver: The long at 37.8 below and the long at 38.8 last Friday, the stop loss followed by the 39.5 holding, the stop loss followed by the 41.5 holding, the long at 42.35 last week, the stop loss followed by the 42.65 and 42.8 and 43-43.2.
Europe and the United States: The long at 1.16600 last week. The stop loss of 17100 was followed by 1.17000, and the stop loss of 1.17400 was 1.17200 today, with a target of 1.7750, and a break of 1.18000 and 1.18200-1.18500.
US crude oil: 62.9 today, with a stop loss of 62.4 after long, with a target of 63.7, with a break of 64 and 64.5 pressure.
Nasdaq: Today's stop loss of 24200 is 24140, with a target of 24300 and 24350 and 24400.
The above content is all about "[XM Foreign Exchange Platform]: Daily positive breaks pressure, gold and silver pullback continues to be long", which was carefully xmaccount.compiled and edited by the editor of XM Foreign Exchange. I hope it will be helpful to your trading! Thanks for the support!
After doing something, there will always be experience and lessons. In order to facilitate future work, we must analyze, study, summarize and concentrate the experience and lessons of previous work, and raise it to the theoretical level to understand it.
Disclaimers: XM Group only provides execution services and access permissions for online trading platforms, and allows individuals to view and/or use the website or the content provided on the website, but has no intention of making any changes or extensions, nor will it change or extend its services and access permissions. All access and usage permissions will be subject to the following terms and conditions: (i) Terms and conditions; (ii) Risk warning; And (iii) a complete disclaimer. Please note that all information provided on the website is for general informational purposes only. In addition, the content of all XM online trading platforms does not constitute, and cannot be used for any unauthorized financial market trading invitations and/or invitations. Financial market transactions pose significant risks to your investment capital.
All materials published on online trading platforms are only intended for educational/informational purposes and do not include or should be considered for financial, investment tax, or trading related consulting and advice, or transaction price records, or any financial product or non invitation related trading offers or invitations.
All content provided by XM and third-party suppliers on this website, including opinions, news, research, analysis, prices, other information, and third-party website links, remains unchanged and is provided as general market commentary rather than investment advice. All materials published on online trading platforms are only for educational/informational purposes and do not include or should be considered as applicable to financial, investment tax, or trading related advice and recommendations, or transaction price records, or any financial product or non invitation related financial offers or invitations. Please ensure that you have read and fully understood the information on XM's non independent investment research tips and risk warnings. For more details, please click here