


Trusted by over 15 Million Traders
The Most Awarded Broker
for a Reason
Easy Access to 1,400+ Global Assets
EURUSD
Euro vs U.S. Dollar
US500
S&P 500 (US500)
GOLD
Gold
COFFEE
US Coffee
Apple
Apple (AAPL.OQ)
-

Finance Magnates 颁发
-

Finance Magnates 颁发
-

Capital Finance International Magazine (CFI.co) 2024年颁赠
-

COLWMA 2024年颁赠
-

荣获World Finance Forex Awards 2023最佳外汇客户服务奖
-

荣获World Finance Forex Awards 2023欧洲最佳外汇经纪商奖
-

荣获World Finance Forex Awards 2023澳大拉西亚最佳外汇经纪商奖
-

荣获World Finance Forex Awards 2023拉丁美洲最佳外汇经纪商奖
-

荣获World Finance Forex Awards 2023中东最佳外汇经纪商奖
-

CFI.co于2023年颁赠
-

荣获2023年City of London Wealth Management Awards
-

荣获2022年埃及金融博览会颁赠
-

荣获2022年City of London Wealth Management Awards
-

CFI.co于2022年颁赠
-

荣获Global Forex Awards 2022 — 零售外汇 颁赠
-
2021年迪拜外汇博览会获颁赠
-

Ultimate Fintech 2021年颁赠
-

荣获2021年City of London Wealth Management Awards
-

FX168于2020年12月颁赠
-

荣获Global Business Awards 2020
-

荣获2020年City of London Wealth Management Awards
-

Capital Finance International Magazine (CFI.co)颁赠
-

Capital Finance International Magazine (CFI.co)颁赠
-

荣获2019年City of London Wealth Management Awards
-

Shares Magazine 授予 UK Forex Awards 2018
-

Capital Finance International Magazine (CFI.co)颁赠
-

Capital Finance International Magazine (CFI.co)颁赠
-

2017年伦敦财富管理奖
-

2016最佳本土 客户服务
-

中东和北非地区(MENA)增长最快的经纪商
-
2015年最佳外汇科技提供商
-
2014年最佳外汇科技提供商
-

2014年最佳外汇科技提供商
-

荣获 The Trading Show 2024年非洲 Africa Fintech 峰会颁赠
-

荣获2024年中东地区 Brokersview 颁赠
-
荣获2024年中东地区 Brokersview 颁赠
-

荣获2024年阿曼 Smart Vision 峰会颁赠
-

荣获2024年迪拜外汇博览会颁赠
-

荣获2024年迪拜 Forex Traders Summit 颁赠
-

2024年埃及 Smart Vision 峰会颁赠
-

投查查于2024年颁赠
-

Capital Finance International Magazine (CFI.co) 2024年颁赠
-

CFI.co于2023年颁赠
-

CFI.co于2023年颁赠
-

交易社区平台FOLLOWME于2022年颁赠
-
2022年迪拜Forex Expo获颁赠
-
2022年迪拜Forex Expo获颁赠
-

荣获Global Forex Awards 2022 — 零售外汇 颁赠
-

CFI.co于2022年颁赠
-

CFI.co于2022年颁赠
-

World Finance Forex Awards 2022 颁发
-

World Finance Forex Awards 2022 颁发
-

World Finance Forex Awards 2022 颁发
-

World Finance Forex Awards 2022 颁发
-
交易社区平台FOLLOWME于2021年颁赠
-

2021年埃及Smart Vision Investment Expo博览会获颁赠
-

CFI.co于2021年颁赠
-

CFI.co于2021年颁赠
-

荣获Global Forex Awards 2021 — 零售外汇 颁赠
-

荣获Global Forex Awards 2021 — 零售外汇 颁赠
-

World Finance 2021颁发
-

World Finance 2021颁发
-
FOLLOWME于2021年颁赠
-

Global Forex Awards 2021 — B2B 颁赠
-

Global Forex Awards颁赠
-

Global Forex Awards颁赠
-

CFI.co于2020年颁赠
-

CFI.co于2020年颁赠
-

荣获Global Business Awards 2020
-

World Finance Magazine 颁赠
World Finance Forex Awards 2020 -

World Finance Magazine 颁赠
World Finance Forex Awards 2020 -
FOLLOWME交易社区授予
-

Global Forex Awards颁赠
-

Global Forex Awards颁赠
-

FinTech Age Awards颁发
-

World Finance Magazine 颁赠
World Finance Forex Awards 2019 -

World Finance Magazine 颁赠
World Finance Forex Awards 2019 -

荣获 World Finance Forex Awards 2018 颁赠
-

荣获2018年埃及金融博览会颁赠
-

荣获 Shares Magazine 的 UK Forex Awards 2017 颁赠
-

荣获 World Finance Forex Awards 2017
-

2016年最佳黄金经纪商
-

2016年最佳外汇经纪商
-

2015年最佳本地客户服务
-

Global Brands Magazine 颁赠
-

Online Money Awards 2022 颁发
-

荣获2022年埃及金融博览会颁赠
-

2015最佳外汇交易平台
-

2015最佳金融交易平台
-

2013最佳创新外汇平台奖
-

2020年 Cyprus HR Awards 颁赠
-

金融行业的佼佼者
-

认证最优金牌级别
-

2014年首届亚军
-
Finance Magnates 颁发
-
Finance Magnates 颁发
-
Capital Finance International Magazine (CFI.co) 2024年颁赠
-
COLWMA 2024年颁赠
-
荣获World Finance Forex Awards 2023最佳外汇客户服务奖
-
荣获World Finance Forex Awards 2023欧洲最佳外汇经纪商奖
-
荣获World Finance Forex Awards 2023澳大拉西亚最佳外汇经纪商奖
-
荣获World Finance Forex Awards 2023拉丁美洲最佳外汇经纪商奖
-
荣获World Finance Forex Awards 2023中东最佳外汇经纪商奖
-
CFI.co于2023年颁赠
-
荣获2023年City of London Wealth Management Awards
-
荣获2022年埃及金融博览会颁赠
-
荣获2022年City of London Wealth Management Awards
-
CFI.co于2022年颁赠
-
荣获Global Forex Awards 2022 — 零售外汇 颁赠
-
2021年迪拜外汇博览会获颁赠
-
Ultimate Fintech 2021年颁赠
-
荣获2021年City of London Wealth Management Awards
-
FX168于2020年12月颁赠
-
荣获Global Business Awards 2020
-
荣获2020年City of London Wealth Management Awards
-
Capital Finance International Magazine (CFI.co)颁赠
-
Capital Finance International Magazine (CFI.co)颁赠
-
荣获2019年City of London Wealth Management Awards
-
Shares Magazine 授予 UK Forex Awards 2018
-
Capital Finance International Magazine (CFI.co)颁赠
-
Capital Finance International Magazine (CFI.co)颁赠
-
2017年伦敦财富管理奖
-
2016最佳本土 客户服务
-
中东和北非地区(MENA)增长最快的经纪商
-
2015年最佳外汇科技提供商
-
2014年最佳外汇科技提供商
-
2014年最佳外汇科技提供商
-
荣获 The Trading Show 2024年非洲 Africa Fintech 峰会颁赠
-
荣获2024年中东地区 Brokersview 颁赠
-
荣获2024年中东地区 Brokersview 颁赠
-
荣获2024年阿曼 Smart Vision 峰会颁赠
-
荣获2024年迪拜外汇博览会颁赠
-
荣获2024年迪拜 Forex Traders Summit 颁赠
-
2024年埃及 Smart Vision 峰会颁赠
-
投查查于2024年颁赠
-
Capital Finance International Magazine (CFI.co) 2024年颁赠
-
CFI.co于2023年颁赠
-
CFI.co于2023年颁赠
-
交易社区平台FOLLOWME于2022年颁赠
-
2022年迪拜Forex Expo获颁赠
-
2022年迪拜Forex Expo获颁赠
-
荣获Global Forex Awards 2022 — 零售外汇 颁赠
-
CFI.co于2022年颁赠
-
CFI.co于2022年颁赠
-
World Finance Forex Awards 2022 颁发
-
World Finance Forex Awards 2022 颁发
-
World Finance Forex Awards 2022 颁发
-
World Finance Forex Awards 2022 颁发
-
交易社区平台FOLLOWME于2021年颁赠
-
2021年埃及Smart Vision Investment Expo博览会获颁赠
-
CFI.co于2021年颁赠
-
CFI.co于2021年颁赠
-
荣获Global Forex Awards 2021 — 零售外汇 颁赠
-
荣获Global Forex Awards 2021 — 零售外汇 颁赠
-
World Finance 2021颁发
-
World Finance 2021颁发
-
FOLLOWME于2021年颁赠
-
Global Forex Awards 2021 — B2B 颁赠
-
Global Forex Awards颁赠
-
Global Forex Awards颁赠
-
CFI.co于2020年颁赠
-
CFI.co于2020年颁赠
-
荣获Global Business Awards 2020
-
World Finance Magazine 颁赠
World Finance Forex Awards 2020 -
World Finance Magazine 颁赠
World Finance Forex Awards 2020 -
FOLLOWME交易社区授予
-
Global Forex Awards颁赠
-
Global Forex Awards颁赠
-
FinTech Age Awards颁发
-
World Finance Magazine 颁赠
World Finance Forex Awards 2019 -
World Finance Magazine 颁赠
World Finance Forex Awards 2019 -
荣获 World Finance Forex Awards 2018 颁赠
-
荣获2018年埃及金融博览会颁赠
-
荣获 Shares Magazine 的 UK Forex Awards 2017 颁赠
-
荣获 World Finance Forex Awards 2017
-
2016年最佳黄金经纪商
-
2016年最佳外汇经纪商
-
2015年最佳本地客户服务
-
Global Brands Magazine 颁赠
-
Online Money Awards 2022 颁发
-
荣获2022年埃及金融博览会颁赠
-
2015最佳外汇交易平台
-
2015最佳金融交易平台
-
2013最佳创新外汇平台奖
-
2020年 Cyprus HR Awards 颁赠
-
金融行业的佼佼者
-
认证最优金牌级别
-
2014年首届亚军

Awarded BestBrokerYear After Year
CATEGORIES
News
- 【XM Market Review】--USD/PHP Forex Signal: Philippine Peso Challenges Dollar in C
- 【XM Market Analysis】--USD/CAD Forecast: Pushes Higher Amid Dollar Strength
- 【XM Market Analysis】--USD/MXN Forecast: Stuck in Range
- 【XM Forex】--GBP/USD Forex Signal: Uptrend Loses Momentum Ahead of Fed Decision
- 【XM Market Review】--GBP/USD Forex Signal: Rising Wedge, Death Cross Patterns For
market analysis
Global trade enters the abyss, gold and silver are oversold in the range
Wonderful introduction:
Without the depth of the blue sky, there can be the elegance of white clouds; without the magnificence of the sea, there can be the elegance of the stream; without the fragrance of the wilderness, there can be the emerald green of the grass. There is no seat for bystanders in life, we can always find our own position, our own light source, and our own voice.
Hello everyone, today XM Foreign Exchange will bring you "[XM Foreign Exchange Market Analysis]: Global trade enters the abyss, gold and silver are oversold and are in the range". Hope it will be helpful to you! The original content is as follows:
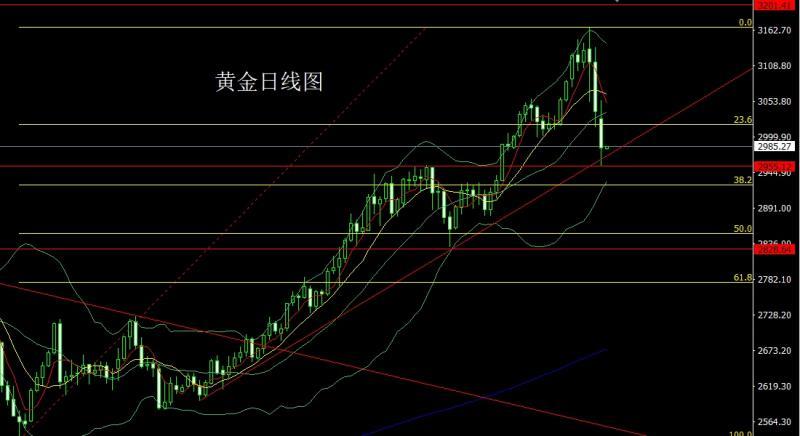
Yesterday, the gold market opened lower in the early trading at 3027.6 and then the market fell first. The position of 2969.9 was given and the market rose strongly. The daily line reached the highest position of 3056.3 and then the market was under pressure and fluctuated and fell. The USxmaccount.comThe market accelerated downward during the trading session, and gradually reached the lowest point of 2955.6. The market was supported by the previous historical high and the upward trend line of this round. The daily line finally closed at the position of 2983. The market closed with a large negative line with an upper shadow line slightly longer than the lower shadow line. After this pattern ended, today's market had a need for consolidation. At the point, if the decline first in the morning trading today, it would give 2958 long conservative 2956 long stop loss 2952. The target was to leave the market near 3000 and 3010 and 3018-3020. If the market directly broke through the support of 2955 in the morning trading, then the 2923 mark will be seen below today.
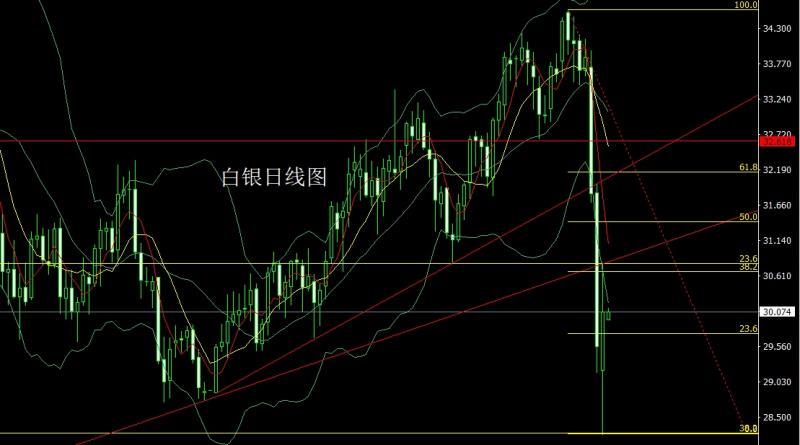
The silver market opened lower yesterday at 29.199 and then fell first, and the daily line was at the lowest level of 28.225.After the position, the market was oversold and strongly rose. After the daily line reached the highest point of 30.833, the market consolidated. The daily line finally closed at 30.076. Then the market closed with a lower shadow line and the big positive line of the upper shadow line. After this pattern ended, if the decline first fell back in the morning of today, the stop loss of 29.2 was 28.9, and the target was 30, 30.5 and 30.8 pressures.
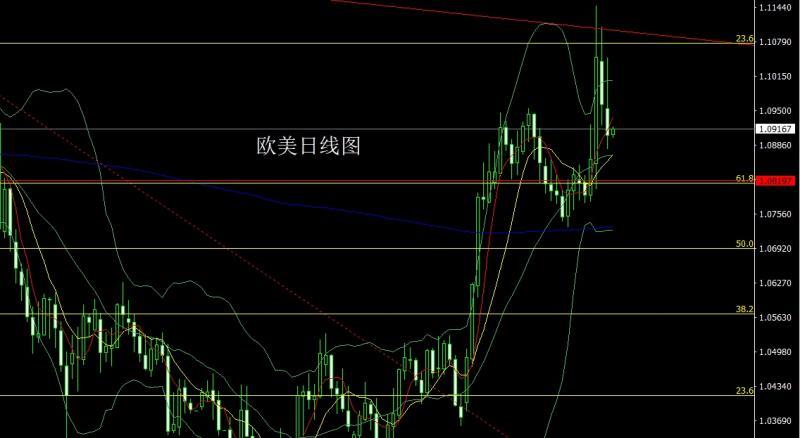
European and American markets continued to fall yesterday. After the market opened at 1.09540 in the morning, the market fell first. The daily line was at the lowest point of 1.08782 and then the market rose strongly. The daily line reached the highest point of 1.10502 and then fell at the end of the trading session. After the daily line finally closed at 1.09040, the daily line closed with a very long upper shadow line. After this pattern ended, today's market continued to be under pressure. At the point, today's market was 1.09850 short stop loss 1.10050, and the target was 1.09200 and 1.08900 and 1.08600.
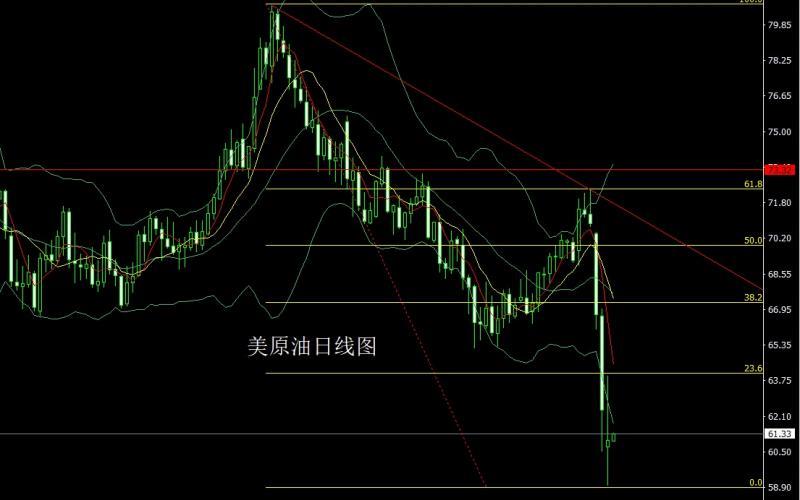
The U.S. crude oil market opened lower at 60.72 yesterday and then fell back. The daily line was at the lowest point of 58.98 and then the market rose strongly. The daily line reached the highest point of 63.96 and then fell back under the pressure of the first pressure point of this cycle. The daily line finally closed at 61.02. After the daily line closed in a long-leg cross-star pattern with an upper shadow line longer than the lower shadow line. After this pattern ended, the short position of 71.9 and short position of 70.3 last week followed by the stop loss at 66. Yesterday, the short position of 63.6 was followed by the stop loss at 64. Today, the short position of 63.6 was around 63.6. The target below looked at the support of 62 and 61 and 60.
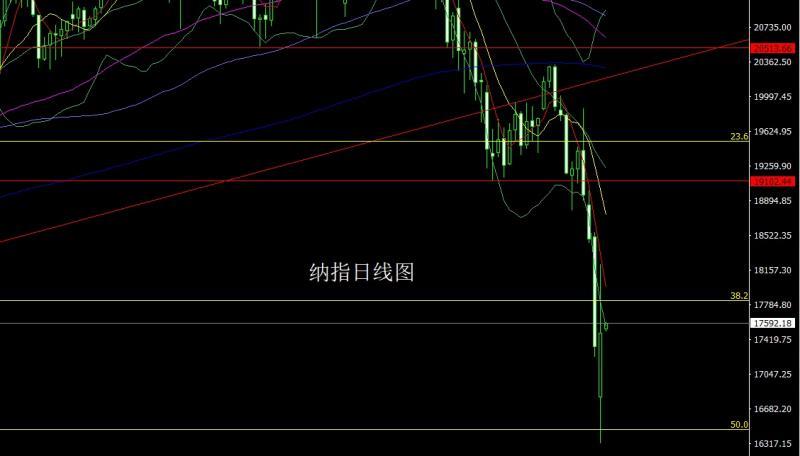
Yesterday, the Nasdaq market came out of extreme market conditions. In the early trading, the trade war escalated last week and the technical pressure opened lower at 16806.74, and the market fell strongly. The market consolidated at a low level. During the US session, the market strongly pulled up and reached the highest point of 18218.8, and then the market fell at the end of the trading session. The daily line finally closed at 17488.53, and the market closed with a large positive line with an upper shadow line longer than the lower shadow line. After this pattern ended, if the 18100 short stop loss in the early trading, the target below 18200 was first seen at 17300, 17000 and 16800 were ready to leave.
State, yesterday's chain reaction caused by fundamental tariffs is still continuing. The US president said he would not suspend reciprocal tariff measures and reject the EU's proposed mutual exemption policy. The EU plans to impose a 25% tariff on some U.S. products, which will be implemented in two steps. The news of "demand tariffs for 90 days" caused a huge shock to the market, and the White House subsequently refuted the rumors. The White House team considers implementing an exporter tax credit policy. The U.S. plans to impose a 34.45% tariff on Canadian timber, currently at 14.4%. Seven Republican senators "turned over" support bills that restrict Trump's tariff powers. The Japanese Prime Minister said he would not fight against the United States. U.S. Treasury Secretary: It is unlikely to reach a trade agreement (with any country) by April 9, with nearly 70 countries seeking negotiations. Regardless of whether the current US government's purpose is shock therapy or to divert contradictions, we are all experiencing an era of drastic changes. There will be no winners in the tariff war, and it will always hurt all ordinary people around the world. This risk will eventually transform into a global economic recession and the Great Depression. Historically, the Great Depression induced World War I and World War II. Therefore, with the intensification of risks, the risk aversion function of the gold market will be further stimulated after this round of adjustments. Today's fundamentals focus mainly on the US March NFIB Small Business Confidence Index at 18:00.
In terms of operation, gold: If the decline first in the morning session today is given a 2958 long conservative 2956 long stop loss 2952. The target is 3000 and 3010 and 3018-3020 and the backhand is empty. If the 2955 support is directly broken through the support level in the morning session, then the 2923 mark will be seen below today.
Silver: If the first fall in the morning session today, stop loss is 29.2 long, 28.9, and the target is 30 and 30.5 and 30.8 pressure.
Europe and the United States: Today's market is 1.09850 short stop loss 1.10050, and the target is 1.09200 and 1.08900 and 1.08600.
U.S. crude oil: Last week's short position of 71.9 and short position of 70.3 were reduced and the stop loss followed at 66, yesterday's short position of 63.6 was held at 64, today's short stop loss around 63.6, and the target below is 62 and 61 and 60 support.
Nasdaq: If you first pull up 18100 in the morning, stop loss 18200, the target below is 17300, 17000 and 16800, and the target below is 17300, 17000 and 16800, and prepare for leaving.
The above content is all about "[XM Foreign Exchange Market Analysis]: Global Trade enters the Abyss, Gold and Silver are oversold and are in the range". It is carefully xmaccount.compiled and edited by the editor of XM Foreign Exchange. I hope it will be helpful to your trading! Thanks for the support!
In fact, responsibility is not helpless, it is not boring, it is as gorgeous as a rainbow. It is this colorful responsibility that has created a better life for us today. I will try my best to organize the article.
Disclaimers: XM Group only provides execution services and access permissions for online trading platforms, and allows individuals to view and/or use the website or the content provided on the website, but has no intention of making any changes or extensions, nor will it change or extend its services and access permissions. All access and usage permissions will be subject to the following terms and conditions: (i) Terms and conditions; (ii) Risk warning; And (iii) a complete disclaimer. Please note that all information provided on the website is for general informational purposes only. In addition, the content of all XM online trading platforms does not constitute, and cannot be used for any unauthorized financial market trading invitations and/or invitations. Financial market transactions pose significant risks to your investment capital.
All materials published on online trading platforms are only intended for educational/informational purposes and do not include or should be considered for financial, investment tax, or trading related consulting and advice, or transaction price records, or any financial product or non invitation related trading offers or invitations.
All content provided by XM and third-party suppliers on this website, including opinions, news, research, analysis, prices, other information, and third-party website links, remains unchanged and is provided as general market commentary rather than investment advice. All materials published on online trading platforms are only for educational/informational purposes and do not include or should be considered as applicable to financial, investment tax, or trading related advice and recommendations, or transaction price records, or any financial product or non invitation related financial offers or invitations. Please ensure that you have read and fully understood the information on XM's non independent investment research tips and risk warnings. For more details, please click here