


Trusted by over 15 Million Traders
The Most Awarded Broker
for a Reason
Easy Access to 1,400+ Global Assets
EURUSD
Euro vs U.S. Dollar
US500
S&P 500 (US500)
GOLD
Gold
COFFEE
US Coffee
Apple
Apple (AAPL.OQ)
-

Finance Magnates 颁发
-

Finance Magnates 颁发
-

Capital Finance International Magazine (CFI.co) 2024年颁赠
-

COLWMA 2024年颁赠
-

荣获World Finance Forex Awards 2023最佳外汇客户服务奖
-

荣获World Finance Forex Awards 2023欧洲最佳外汇经纪商奖
-

荣获World Finance Forex Awards 2023澳大拉西亚最佳外汇经纪商奖
-

荣获World Finance Forex Awards 2023拉丁美洲最佳外汇经纪商奖
-

荣获World Finance Forex Awards 2023中东最佳外汇经纪商奖
-

CFI.co于2023年颁赠
-

荣获2023年City of London Wealth Management Awards
-

荣获2022年埃及金融博览会颁赠
-

荣获2022年City of London Wealth Management Awards
-

CFI.co于2022年颁赠
-

荣获Global Forex Awards 2022 — 零售外汇 颁赠
-
2021年迪拜外汇博览会获颁赠
-

Ultimate Fintech 2021年颁赠
-

荣获2021年City of London Wealth Management Awards
-

FX168于2020年12月颁赠
-

荣获Global Business Awards 2020
-

荣获2020年City of London Wealth Management Awards
-

Capital Finance International Magazine (CFI.co)颁赠
-

Capital Finance International Magazine (CFI.co)颁赠
-

荣获2019年City of London Wealth Management Awards
-

Shares Magazine 授予 UK Forex Awards 2018
-

Capital Finance International Magazine (CFI.co)颁赠
-

Capital Finance International Magazine (CFI.co)颁赠
-

2017年伦敦财富管理奖
-

2016最佳本土 客户服务
-

中东和北非地区(MENA)增长最快的经纪商
-
2015年最佳外汇科技提供商
-
2014年最佳外汇科技提供商
-

2014年最佳外汇科技提供商
-

荣获 The Trading Show 2024年非洲 Africa Fintech 峰会颁赠
-

荣获2024年中东地区 Brokersview 颁赠
-
荣获2024年中东地区 Brokersview 颁赠
-

荣获2024年阿曼 Smart Vision 峰会颁赠
-

荣获2024年迪拜外汇博览会颁赠
-

荣获2024年迪拜 Forex Traders Summit 颁赠
-

2024年埃及 Smart Vision 峰会颁赠
-

投查查于2024年颁赠
-

Capital Finance International Magazine (CFI.co) 2024年颁赠
-

CFI.co于2023年颁赠
-

CFI.co于2023年颁赠
-

交易社区平台FOLLOWME于2022年颁赠
-
2022年迪拜Forex Expo获颁赠
-
2022年迪拜Forex Expo获颁赠
-

荣获Global Forex Awards 2022 — 零售外汇 颁赠
-

CFI.co于2022年颁赠
-

CFI.co于2022年颁赠
-

World Finance Forex Awards 2022 颁发
-

World Finance Forex Awards 2022 颁发
-

World Finance Forex Awards 2022 颁发
-

World Finance Forex Awards 2022 颁发
-
交易社区平台FOLLOWME于2021年颁赠
-

2021年埃及Smart Vision Investment Expo博览会获颁赠
-

CFI.co于2021年颁赠
-

CFI.co于2021年颁赠
-

荣获Global Forex Awards 2021 — 零售外汇 颁赠
-

荣获Global Forex Awards 2021 — 零售外汇 颁赠
-

World Finance 2021颁发
-

World Finance 2021颁发
-
FOLLOWME于2021年颁赠
-

Global Forex Awards 2021 — B2B 颁赠
-

Global Forex Awards颁赠
-

Global Forex Awards颁赠
-

CFI.co于2020年颁赠
-

CFI.co于2020年颁赠
-

荣获Global Business Awards 2020
-

World Finance Magazine 颁赠
World Finance Forex Awards 2020 -

World Finance Magazine 颁赠
World Finance Forex Awards 2020 -
FOLLOWME交易社区授予
-

Global Forex Awards颁赠
-

Global Forex Awards颁赠
-

FinTech Age Awards颁发
-

World Finance Magazine 颁赠
World Finance Forex Awards 2019 -

World Finance Magazine 颁赠
World Finance Forex Awards 2019 -

荣获 World Finance Forex Awards 2018 颁赠
-

荣获2018年埃及金融博览会颁赠
-

荣获 Shares Magazine 的 UK Forex Awards 2017 颁赠
-

荣获 World Finance Forex Awards 2017
-

2016年最佳黄金经纪商
-

2016年最佳外汇经纪商
-

2015年最佳本地客户服务
-

Global Brands Magazine 颁赠
-

Online Money Awards 2022 颁发
-

荣获2022年埃及金融博览会颁赠
-

2015最佳外汇交易平台
-

2015最佳金融交易平台
-

2013最佳创新外汇平台奖
-

2020年 Cyprus HR Awards 颁赠
-

金融行业的佼佼者
-

认证最优金牌级别
-

2014年首届亚军
-
Finance Magnates 颁发
-
Finance Magnates 颁发
-
Capital Finance International Magazine (CFI.co) 2024年颁赠
-
COLWMA 2024年颁赠
-
荣获World Finance Forex Awards 2023最佳外汇客户服务奖
-
荣获World Finance Forex Awards 2023欧洲最佳外汇经纪商奖
-
荣获World Finance Forex Awards 2023澳大拉西亚最佳外汇经纪商奖
-
荣获World Finance Forex Awards 2023拉丁美洲最佳外汇经纪商奖
-
荣获World Finance Forex Awards 2023中东最佳外汇经纪商奖
-
CFI.co于2023年颁赠
-
荣获2023年City of London Wealth Management Awards
-
荣获2022年埃及金融博览会颁赠
-
荣获2022年City of London Wealth Management Awards
-
CFI.co于2022年颁赠
-
荣获Global Forex Awards 2022 — 零售外汇 颁赠
-
2021年迪拜外汇博览会获颁赠
-
Ultimate Fintech 2021年颁赠
-
荣获2021年City of London Wealth Management Awards
-
FX168于2020年12月颁赠
-
荣获Global Business Awards 2020
-
荣获2020年City of London Wealth Management Awards
-
Capital Finance International Magazine (CFI.co)颁赠
-
Capital Finance International Magazine (CFI.co)颁赠
-
荣获2019年City of London Wealth Management Awards
-
Shares Magazine 授予 UK Forex Awards 2018
-
Capital Finance International Magazine (CFI.co)颁赠
-
Capital Finance International Magazine (CFI.co)颁赠
-
2017年伦敦财富管理奖
-
2016最佳本土 客户服务
-
中东和北非地区(MENA)增长最快的经纪商
-
2015年最佳外汇科技提供商
-
2014年最佳外汇科技提供商
-
2014年最佳外汇科技提供商
-
荣获 The Trading Show 2024年非洲 Africa Fintech 峰会颁赠
-
荣获2024年中东地区 Brokersview 颁赠
-
荣获2024年中东地区 Brokersview 颁赠
-
荣获2024年阿曼 Smart Vision 峰会颁赠
-
荣获2024年迪拜外汇博览会颁赠
-
荣获2024年迪拜 Forex Traders Summit 颁赠
-
2024年埃及 Smart Vision 峰会颁赠
-
投查查于2024年颁赠
-
Capital Finance International Magazine (CFI.co) 2024年颁赠
-
CFI.co于2023年颁赠
-
CFI.co于2023年颁赠
-
交易社区平台FOLLOWME于2022年颁赠
-
2022年迪拜Forex Expo获颁赠
-
2022年迪拜Forex Expo获颁赠
-
荣获Global Forex Awards 2022 — 零售外汇 颁赠
-
CFI.co于2022年颁赠
-
CFI.co于2022年颁赠
-
World Finance Forex Awards 2022 颁发
-
World Finance Forex Awards 2022 颁发
-
World Finance Forex Awards 2022 颁发
-
World Finance Forex Awards 2022 颁发
-
交易社区平台FOLLOWME于2021年颁赠
-
2021年埃及Smart Vision Investment Expo博览会获颁赠
-
CFI.co于2021年颁赠
-
CFI.co于2021年颁赠
-
荣获Global Forex Awards 2021 — 零售外汇 颁赠
-
荣获Global Forex Awards 2021 — 零售外汇 颁赠
-
World Finance 2021颁发
-
World Finance 2021颁发
-
FOLLOWME于2021年颁赠
-
Global Forex Awards 2021 — B2B 颁赠
-
Global Forex Awards颁赠
-
Global Forex Awards颁赠
-
CFI.co于2020年颁赠
-
CFI.co于2020年颁赠
-
荣获Global Business Awards 2020
-
World Finance Magazine 颁赠
World Finance Forex Awards 2020 -
World Finance Magazine 颁赠
World Finance Forex Awards 2020 -
FOLLOWME交易社区授予
-
Global Forex Awards颁赠
-
Global Forex Awards颁赠
-
FinTech Age Awards颁发
-
World Finance Magazine 颁赠
World Finance Forex Awards 2019 -
World Finance Magazine 颁赠
World Finance Forex Awards 2019 -
荣获 World Finance Forex Awards 2018 颁赠
-
荣获2018年埃及金融博览会颁赠
-
荣获 Shares Magazine 的 UK Forex Awards 2017 颁赠
-
荣获 World Finance Forex Awards 2017
-
2016年最佳黄金经纪商
-
2016年最佳外汇经纪商
-
2015年最佳本地客户服务
-
Global Brands Magazine 颁赠
-
Online Money Awards 2022 颁发
-
荣获2022年埃及金融博览会颁赠
-
2015最佳外汇交易平台
-
2015最佳金融交易平台
-
2013最佳创新外汇平台奖
-
2020年 Cyprus HR Awards 颁赠
-
金融行业的佼佼者
-
认证最优金牌级别
-
2014年首届亚军

Awarded BestBrokerYear After Year
CATEGORIES
News
- 【XM Market Analysis】--NZD/USD Analysis: Long-Term Lower Values Seen as Nervousne
- 【XM Group】--USD/JPY Forex Signal: Continues to Look Strong
- 【XM Group】--EUR/USD Forecast: Continues its Collapse
- 【XM Market Analysis】--EUR/USD Analysis: Stagnant Downward Trend Ahead of Key Eve
- 【XM Market Analysis】--EUR/CHF Forecast: Finds Support at 0.92
market news
Gold is bullish on the four-hour line, and the upward trend of Europe and the United States is positive
Wonderful introduction:
Optimism is the line of egrets that are straight up to the blue sky, optimism is the ten thousand white sails beside the sunken boat, optimism is the lush grass that blows with the wind on the head of the parrot island, optimism is the falling red spots that turn into spring mud to protect the flowers.
Hello everyone, today XM Foreign Exchange will bring you "[XM Foreign Exchange Decision Analysis]: Gold is bullish on the four-hour line, and the upward trend of Europe and the United States is positive." Hope it will be helpful to you! The original content is as follows:
Macro
The global economic situation has been xmaccount.complex and changeable recently, and major events have far-reaching impacts. In terms of trade, although the United States exempts tariffs on some products, its repeated policies have led to intensification of trade tensions. Asian powers impose 125% tariffs on US imported goods, impacting the global industrial chain and supply chain. Inflation is severe, US economic data is contradictory, the University of Michigan's consumer confidence index hit a low in April, but one-year inflation expectations soared. Although the PPI in March fell month-on-month, it still rose year-on-year. The acting chairman of the New York Fed warned that tariffs pushed up inflation and curb economic growth. In the financial market, interest rate futures show that the Fed's probability of cutting interest rates in June is 75%, and it is expected to be three times throughout the year. Loose expectations and inflation strengthen gold's anti-inflation, but US bonds are selling, resulting in higher yields and liquidity crisis in bond markets. The gold market was supported by the central bank's gold purchases and ETF inflows, and geopolitical conflicts consolidated its risk-haven position. Looking ahead to this week, investors need to pay attention to the trade situation and risk aversion. US "terrorist data" and the European Central Bank interest rate resolution will also affect global financial markets, and policy makers and investors need to respond carefully.
Dollar Index
In terms of the performance of the US dollar index, the US dollar index showed a significant downward trend last Friday. On that day, the price of the US dollar index rose to 100.984, and fell to 98.98 at the lowest, and finally closed at 99.819. Looking back at the price fluctuations of the US dollar index last Friday, after the opening in the morning, the price quickly fell into a short-term pressure state, continuing the downward trend. Entering the European session, prices fell further, setting a new intraday low. Although the US market rebounded to a certain extent, it still failed to break through the high point of the European session. In the end, the daily line closed with a large negative line, which undoubtedly indicates that the US dollar index is still in a bearish trend as a whole.
Through in-depth analysis of multiple cycles of the US dollar index, we can clearly discover some key points and trend characteristics.
From the weekly level, the resistance in the 105 area is extremely critical, which can be regarded as an important watershed in judging the mid-term trend of the US dollar index. If the current US dollar index price continues to remain below this position, then from a medium-term perspective, the trend of the US dollar index will be more bearish. Even if there is an upward trend during the period, it can be regarded as a repairing fluctuation during the mid-line downward trend.
At the daily level, it is currently necessary to focus on the resistance level in the 102.80 area, which plays a decisive role in judging the band trend of the US dollar index. As long as the price is below this position, you can operate according to the idea of short sellers in the band.
As for the four-hour level, as time goes by, we need to focus on the resistance level in the short term in the range of 103.30-40. This range is the key dividing line for judging the short-term trend of the US dollar index. As long as the price is below this range, the short-term support level can be paid attention to the 98.70-98 area.
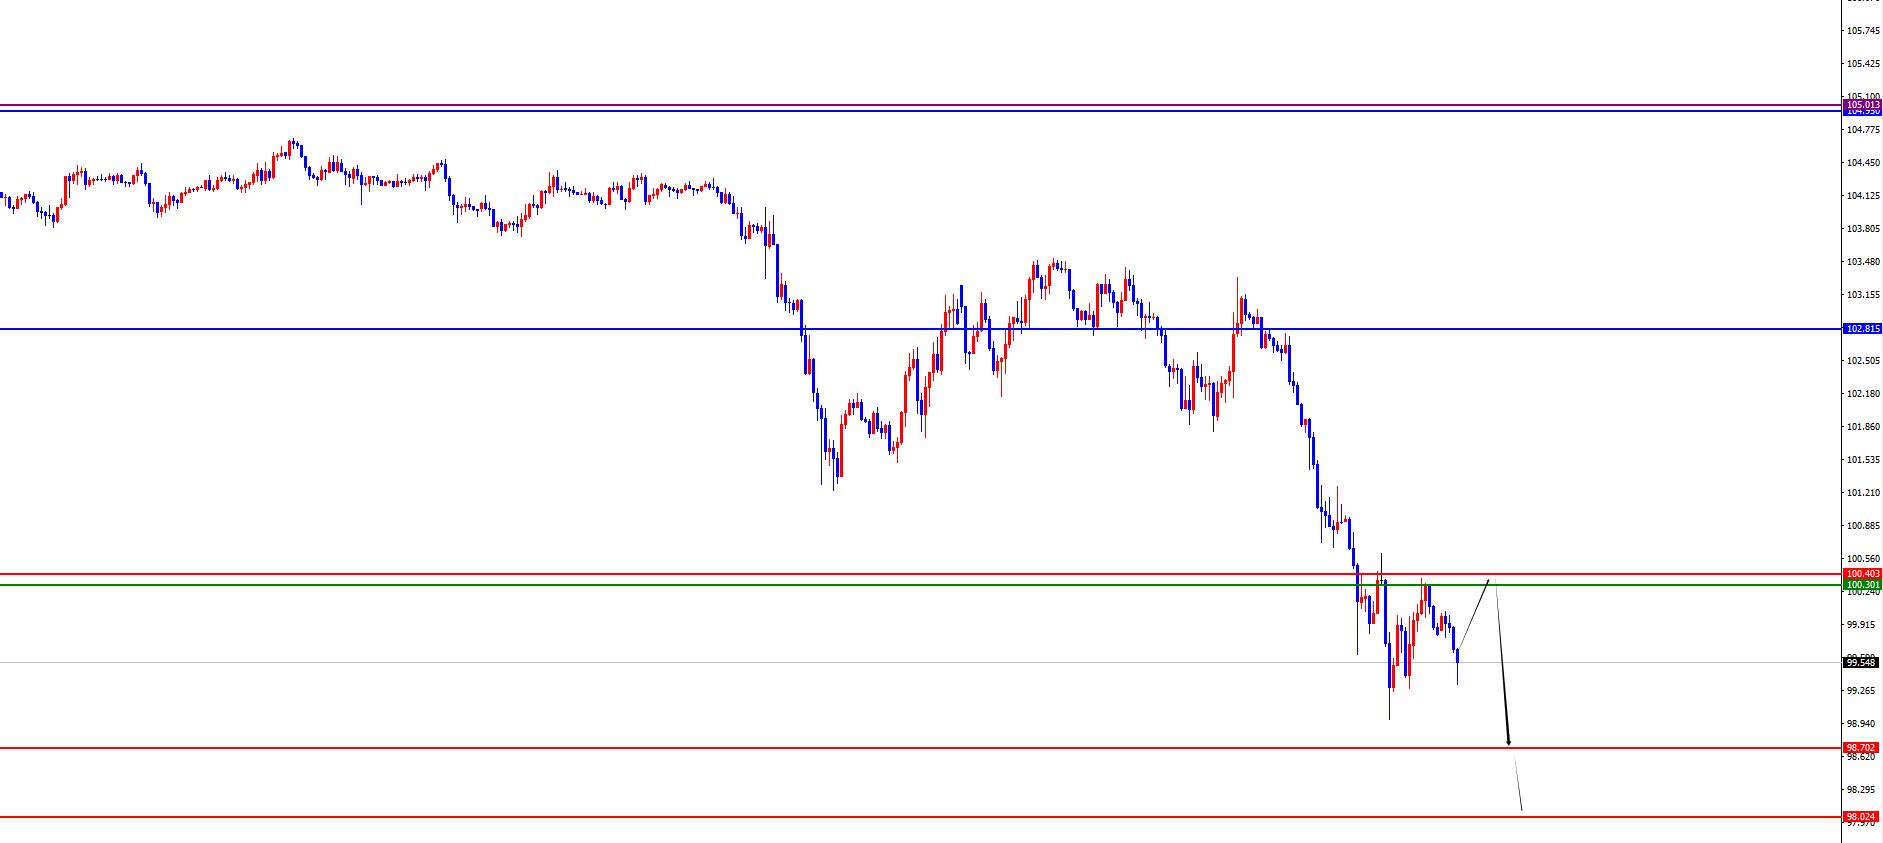
The US dollar index was short in the range of 100.30-40, defending 5 US dollars, targeting 98.70-98
Gold
In terms of gold, the price of gold generally showed a sharp rise last Friday, with the highest price rising to 3245.18 on the day, falling to 3176.01 on the lowest price, and closing at 3237.74 on the day. In response to the short-term trend of the price during the early trading session last Friday, the European and US markets showed a volatile upward rhythm. Finally, the big positive state of the online price on the same day and weekly ended. Overall, there is still room for gold to rise in the future. From a technical analysis perspective, gold's trend at the beginning of last week was relatively restrained, and the price has been running below the resistance position shown in the four-hour chart. However, by Wednesday, gold prices showed strong breakthrough power, not only successfully breaking through the four-hour resistance level, but also further breaking through the daily resistance level. This breakthrough has led to a short-term and band upward trend, and at the end of the week, gold prices continued to soar and the rise was rapid.
As far as the current situation goes by, as time goes by, from the weekly level, gold needs to focus on the support level in the 2957 area. This position is a key watershed in the mid-term trend of gold. If the gold price can be maintained above this position, then from the mid-term perspective, we can continue to maintain a bullish view.
After observing from the daily level, we need to pay attention to the watershed of the 3100 area for the time being. When the gold price is above this position, we can continue to look bullish from the perspective of the band. Even if the price drops, we can also regard it as a normal correction during the rise of the band.
As for the four-hour level, we need to focus on the support level in the 3186 area for the time being. This position is the key dividing line that determines the short-term trend of gold. The price above this position will continue to be treated more in the short term. In addition, given the recent strong performance of gold, if the price directly breaks through the previous day's high during the Asian session, then we can rely on the support of the low point in the morning to continue to be optimistic about the continued market of gold bulls. The resistance area above can be paid attention to the range 3260-3290.
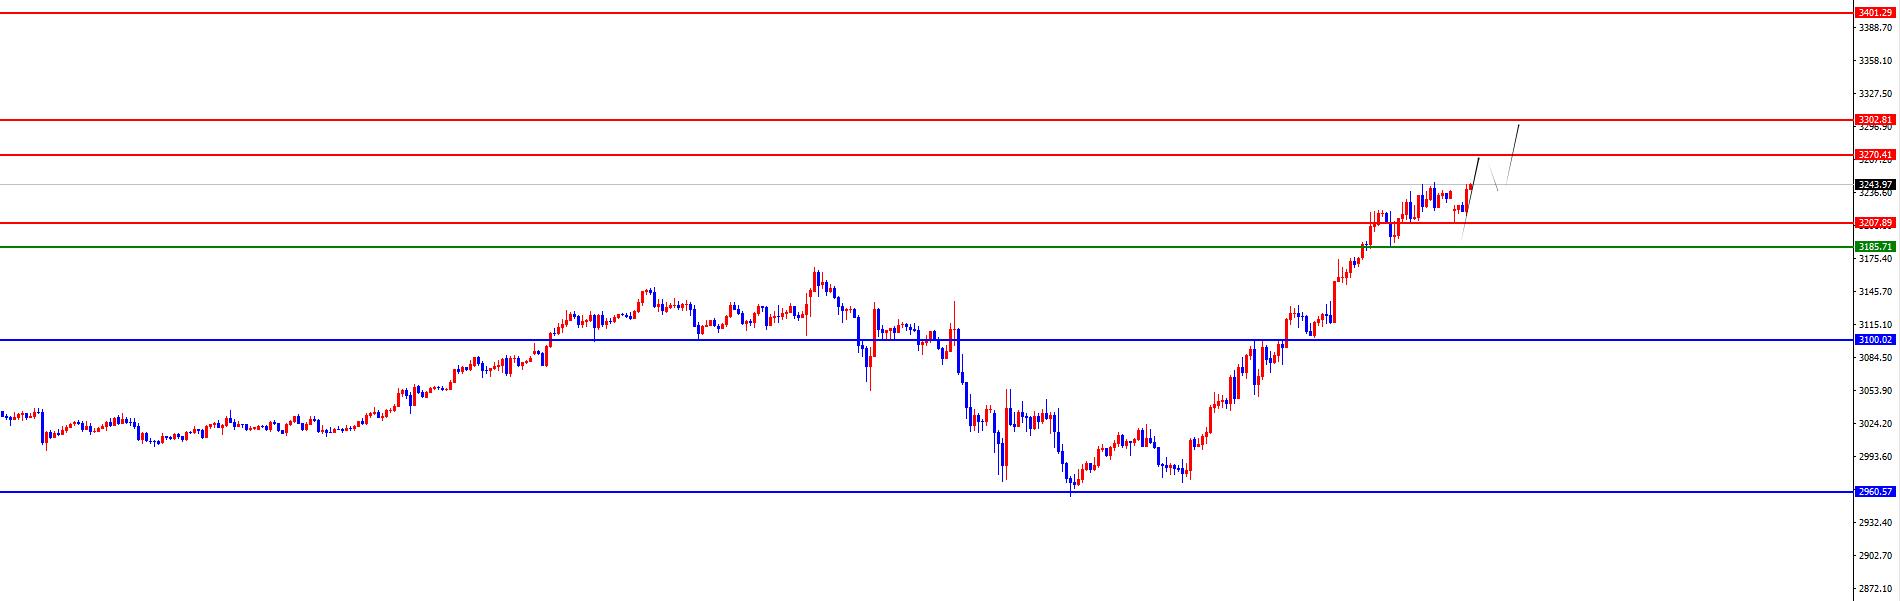
Gold broke through the new high and broke through the new high for 30xmaccount.com26-27 range, with a defense of US$10, and a target of 3260-3290
European and American
European and American prices overall showed an upward trend last Friday. The price fell to 1.1185 on the day and rose to 1.1473 on the spot and closed at 1.1350 on the spot. Looking back at the performance of European and American markets last Friday, the opening price rose directly in the short term, and then the European session rose and fell in the short term. Although the US session fell, it still did not affect the overall bulls. In the end, the weekly online positive ended, and the overall layout continued to be more treated on lows in the future.
Through careful analysis of multi-cycle, we can clearly grasp the trends of European and American currency pairs.
From the monthly level, the prices of European and American currency pairs are currently above 1.0770. At the same time, from the perspective of the trend line, the price has successfully broken through the downward trend line formed at the previous monthly line level. This breakthrough is of great significance, indicating that the market trend has changed, so in subsequent operations, we can firmly treat it with a long-term bullish idea.
Following the weekly level, the support level in the 1.0730 region has become particularly critical over time, and it can be regarded as an important watershed for the mid-term trend of European and American currencies. As long as the price remains above this position, we can continue to look bullish from the mid-line perspective. Even if the price falls, it should be temporarily regarded as a normal correction in the upward trend.
Looking at the daily level again, we need to focus on the watershed of the 1.0970 area. When the price is above this position, we can operate according to the idea of the band bulls. If the price drops during the period, it can also be regarded as a normal pullback during the band rise.
As for the short-term four-hour level, we need to focus on the support level in the 1.1240 area for the time being. In actual operation, the support of the 1.1300-1.1310 range is also worth paying close attention to. In terms of price upward trend, you can focus on the resistance situation in the 1.1500-1.1600 area above in the future to judge the further price increase and trend change.change.
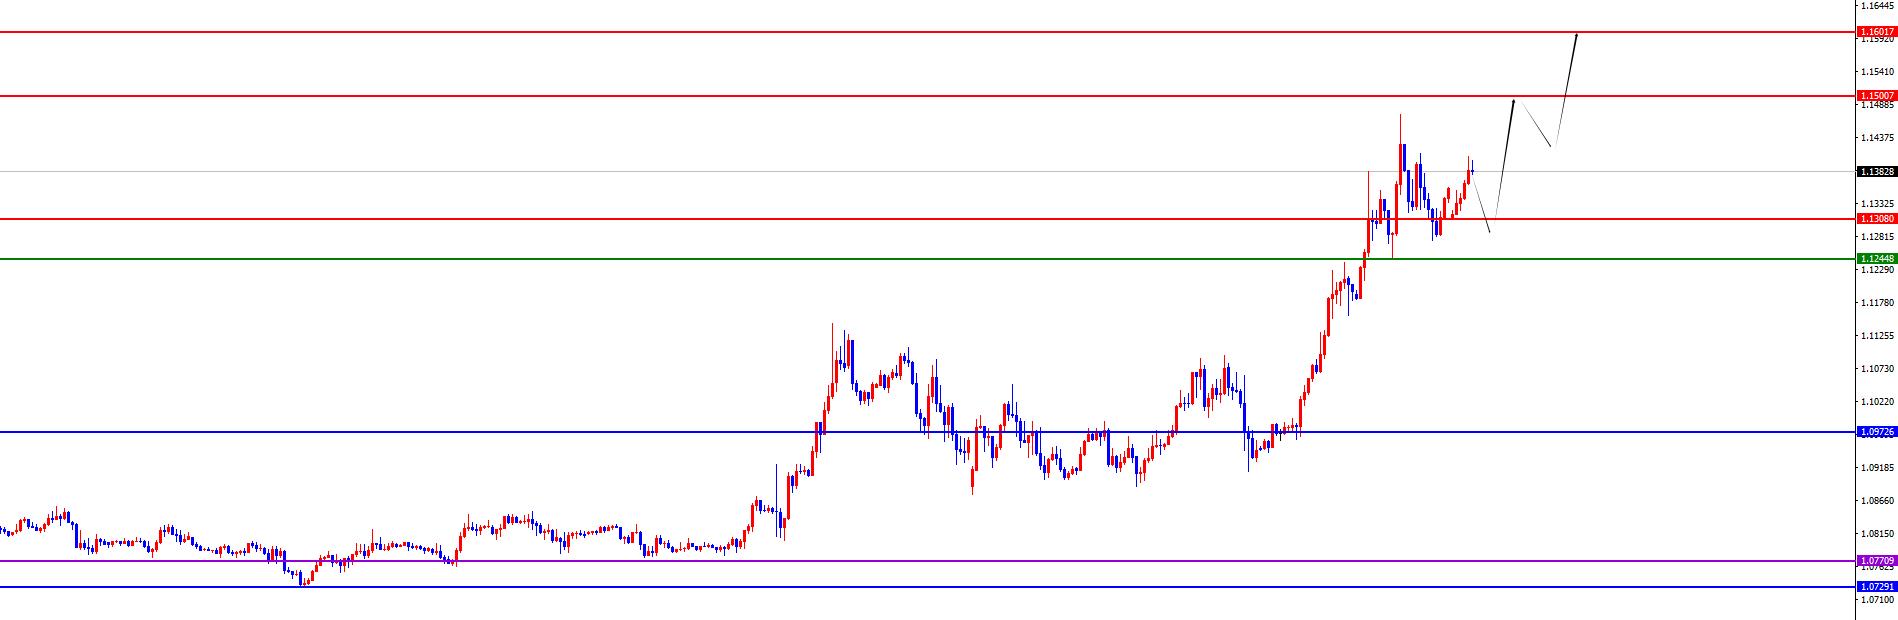
Europe and the United States have a range of 1.1300-1.1310, with a defense of 40 points, and a target of 1.1500-1.1600
[Finance data and events that are focused today] Monday, April 14, 2025
①To be determined China's March trade account
②To be determined OPEC released its monthly crude oil market report
③To be determined President Xi Jinping paid a state visit to Vietnam
④To be determined US President Trump announced the details of semiconductor tariffs
⑤10:00 State Information Office held a press conference on imports and exports in the first quarter
⑥20:30 Canada's February wholesale sales monthly rate
⑦23:00 US New York Fed's 1 year inflation in March Expected
⑧The next day, the Federal Reserve Barkin made a speech on the fog of the economy"
⑨The next day, the Federal Reserve Hack made a speech on the role played by the Federal Reserve
Note: The above is only personal opinions and strategies, for reference and xmaccount.communication only, and does not give customers any investment advice. It has nothing to do with customers' investment, and it is not used as a basis for placing an order.
The above content is all about "[XM Foreign Exchange Decision Analysis]: Gold is bullish on the four-hour line, and the upward trend in Europe and the United States is positive". It was carefully xmaccount.compiled and edited by the editor of XM Foreign Exchange. I hope it will be helpful to your trading! Thank you for your support!
Spring, summer, autumn and winter, every season is a beautiful scenery, and it stays in my heart forever. I slipped away~~~
Disclaimers: XM Group only provides execution services and access permissions for online trading platforms, and allows individuals to view and/or use the website or the content provided on the website, but has no intention of making any changes or extensions, nor will it change or extend its services and access permissions. All access and usage permissions will be subject to the following terms and conditions: (i) Terms and conditions; (ii) Risk warning; And (iii) a complete disclaimer. Please note that all information provided on the website is for general informational purposes only. In addition, the content of all XM online trading platforms does not constitute, and cannot be used for any unauthorized financial market trading invitations and/or invitations. Financial market transactions pose significant risks to your investment capital.
All materials published on online trading platforms are only intended for educational/informational purposes and do not include or should be considered for financial, investment tax, or trading related consulting and advice, or transaction price records, or any financial product or non invitation related trading offers or invitations.
All content provided by XM and third-party suppliers on this website, including opinions, news, research, analysis, prices, other information, and third-party website links, remains unchanged and is provided as general market commentary rather than investment advice. All materials published on online trading platforms are only for educational/informational purposes and do not include or should be considered as applicable to financial, investment tax, or trading related advice and recommendations, or transaction price records, or any financial product or non invitation related financial offers or invitations. Please ensure that you have read and fully understood the information on XM's non independent investment research tips and risk warnings. For more details, please click here