


Trusted by over 15 Million Traders
The Most Awarded Broker
for a Reason
Easy Access to 1,400+ Global Assets
EURUSD
Euro vs U.S. Dollar
US500
S&P 500 (US500)
GOLD
Gold
COFFEE
US Coffee
Apple
Apple (AAPL.OQ)
-

Finance Magnates 颁发
-

Finance Magnates 颁发
-

Capital Finance International Magazine (CFI.co) 2024年颁赠
-

COLWMA 2024年颁赠
-

荣获World Finance Forex Awards 2023最佳外汇客户服务奖
-

荣获World Finance Forex Awards 2023欧洲最佳外汇经纪商奖
-

荣获World Finance Forex Awards 2023澳大拉西亚最佳外汇经纪商奖
-

荣获World Finance Forex Awards 2023拉丁美洲最佳外汇经纪商奖
-

荣获World Finance Forex Awards 2023中东最佳外汇经纪商奖
-

CFI.co于2023年颁赠
-

荣获2023年City of London Wealth Management Awards
-

荣获2022年埃及金融博览会颁赠
-

荣获2022年City of London Wealth Management Awards
-

CFI.co于2022年颁赠
-

荣获Global Forex Awards 2022 — 零售外汇 颁赠
-
2021年迪拜外汇博览会获颁赠
-

Ultimate Fintech 2021年颁赠
-

荣获2021年City of London Wealth Management Awards
-

FX168于2020年12月颁赠
-

荣获Global Business Awards 2020
-

荣获2020年City of London Wealth Management Awards
-

Capital Finance International Magazine (CFI.co)颁赠
-

Capital Finance International Magazine (CFI.co)颁赠
-

荣获2019年City of London Wealth Management Awards
-

Shares Magazine 授予 UK Forex Awards 2018
-

Capital Finance International Magazine (CFI.co)颁赠
-

Capital Finance International Magazine (CFI.co)颁赠
-

2017年伦敦财富管理奖
-

2016最佳本土 客户服务
-

中东和北非地区(MENA)增长最快的经纪商
-
2015年最佳外汇科技提供商
-
2014年最佳外汇科技提供商
-

2014年最佳外汇科技提供商
-

荣获 The Trading Show 2024年非洲 Africa Fintech 峰会颁赠
-

荣获2024年中东地区 Brokersview 颁赠
-
荣获2024年中东地区 Brokersview 颁赠
-

荣获2024年阿曼 Smart Vision 峰会颁赠
-

荣获2024年迪拜外汇博览会颁赠
-

荣获2024年迪拜 Forex Traders Summit 颁赠
-

2024年埃及 Smart Vision 峰会颁赠
-

投查查于2024年颁赠
-

Capital Finance International Magazine (CFI.co) 2024年颁赠
-

CFI.co于2023年颁赠
-

CFI.co于2023年颁赠
-

交易社区平台FOLLOWME于2022年颁赠
-
2022年迪拜Forex Expo获颁赠
-
2022年迪拜Forex Expo获颁赠
-

荣获Global Forex Awards 2022 — 零售外汇 颁赠
-

CFI.co于2022年颁赠
-

CFI.co于2022年颁赠
-

World Finance Forex Awards 2022 颁发
-

World Finance Forex Awards 2022 颁发
-

World Finance Forex Awards 2022 颁发
-

World Finance Forex Awards 2022 颁发
-
交易社区平台FOLLOWME于2021年颁赠
-

2021年埃及Smart Vision Investment Expo博览会获颁赠
-

CFI.co于2021年颁赠
-

CFI.co于2021年颁赠
-

荣获Global Forex Awards 2021 — 零售外汇 颁赠
-

荣获Global Forex Awards 2021 — 零售外汇 颁赠
-

World Finance 2021颁发
-

World Finance 2021颁发
-
FOLLOWME于2021年颁赠
-

Global Forex Awards 2021 — B2B 颁赠
-

Global Forex Awards颁赠
-

Global Forex Awards颁赠
-

CFI.co于2020年颁赠
-

CFI.co于2020年颁赠
-

荣获Global Business Awards 2020
-

World Finance Magazine 颁赠
World Finance Forex Awards 2020 -

World Finance Magazine 颁赠
World Finance Forex Awards 2020 -
FOLLOWME交易社区授予
-

Global Forex Awards颁赠
-

Global Forex Awards颁赠
-

FinTech Age Awards颁发
-

World Finance Magazine 颁赠
World Finance Forex Awards 2019 -

World Finance Magazine 颁赠
World Finance Forex Awards 2019 -

荣获 World Finance Forex Awards 2018 颁赠
-

荣获2018年埃及金融博览会颁赠
-

荣获 Shares Magazine 的 UK Forex Awards 2017 颁赠
-

荣获 World Finance Forex Awards 2017
-

2016年最佳黄金经纪商
-

2016年最佳外汇经纪商
-

2015年最佳本地客户服务
-

Global Brands Magazine 颁赠
-

Online Money Awards 2022 颁发
-

荣获2022年埃及金融博览会颁赠
-

2015最佳外汇交易平台
-

2015最佳金融交易平台
-

2013最佳创新外汇平台奖
-

2020年 Cyprus HR Awards 颁赠
-

金融行业的佼佼者
-

认证最优金牌级别
-

2014年首届亚军
-
Finance Magnates 颁发
-
Finance Magnates 颁发
-
Capital Finance International Magazine (CFI.co) 2024年颁赠
-
COLWMA 2024年颁赠
-
荣获World Finance Forex Awards 2023最佳外汇客户服务奖
-
荣获World Finance Forex Awards 2023欧洲最佳外汇经纪商奖
-
荣获World Finance Forex Awards 2023澳大拉西亚最佳外汇经纪商奖
-
荣获World Finance Forex Awards 2023拉丁美洲最佳外汇经纪商奖
-
荣获World Finance Forex Awards 2023中东最佳外汇经纪商奖
-
CFI.co于2023年颁赠
-
荣获2023年City of London Wealth Management Awards
-
荣获2022年埃及金融博览会颁赠
-
荣获2022年City of London Wealth Management Awards
-
CFI.co于2022年颁赠
-
荣获Global Forex Awards 2022 — 零售外汇 颁赠
-
2021年迪拜外汇博览会获颁赠
-
Ultimate Fintech 2021年颁赠
-
荣获2021年City of London Wealth Management Awards
-
FX168于2020年12月颁赠
-
荣获Global Business Awards 2020
-
荣获2020年City of London Wealth Management Awards
-
Capital Finance International Magazine (CFI.co)颁赠
-
Capital Finance International Magazine (CFI.co)颁赠
-
荣获2019年City of London Wealth Management Awards
-
Shares Magazine 授予 UK Forex Awards 2018
-
Capital Finance International Magazine (CFI.co)颁赠
-
Capital Finance International Magazine (CFI.co)颁赠
-
2017年伦敦财富管理奖
-
2016最佳本土 客户服务
-
中东和北非地区(MENA)增长最快的经纪商
-
2015年最佳外汇科技提供商
-
2014年最佳外汇科技提供商
-
2014年最佳外汇科技提供商
-
荣获 The Trading Show 2024年非洲 Africa Fintech 峰会颁赠
-
荣获2024年中东地区 Brokersview 颁赠
-
荣获2024年中东地区 Brokersview 颁赠
-
荣获2024年阿曼 Smart Vision 峰会颁赠
-
荣获2024年迪拜外汇博览会颁赠
-
荣获2024年迪拜 Forex Traders Summit 颁赠
-
2024年埃及 Smart Vision 峰会颁赠
-
投查查于2024年颁赠
-
Capital Finance International Magazine (CFI.co) 2024年颁赠
-
CFI.co于2023年颁赠
-
CFI.co于2023年颁赠
-
交易社区平台FOLLOWME于2022年颁赠
-
2022年迪拜Forex Expo获颁赠
-
2022年迪拜Forex Expo获颁赠
-
荣获Global Forex Awards 2022 — 零售外汇 颁赠
-
CFI.co于2022年颁赠
-
CFI.co于2022年颁赠
-
World Finance Forex Awards 2022 颁发
-
World Finance Forex Awards 2022 颁发
-
World Finance Forex Awards 2022 颁发
-
World Finance Forex Awards 2022 颁发
-
交易社区平台FOLLOWME于2021年颁赠
-
2021年埃及Smart Vision Investment Expo博览会获颁赠
-
CFI.co于2021年颁赠
-
CFI.co于2021年颁赠
-
荣获Global Forex Awards 2021 — 零售外汇 颁赠
-
荣获Global Forex Awards 2021 — 零售外汇 颁赠
-
World Finance 2021颁发
-
World Finance 2021颁发
-
FOLLOWME于2021年颁赠
-
Global Forex Awards 2021 — B2B 颁赠
-
Global Forex Awards颁赠
-
Global Forex Awards颁赠
-
CFI.co于2020年颁赠
-
CFI.co于2020年颁赠
-
荣获Global Business Awards 2020
-
World Finance Magazine 颁赠
World Finance Forex Awards 2020 -
World Finance Magazine 颁赠
World Finance Forex Awards 2020 -
FOLLOWME交易社区授予
-
Global Forex Awards颁赠
-
Global Forex Awards颁赠
-
FinTech Age Awards颁发
-
World Finance Magazine 颁赠
World Finance Forex Awards 2019 -
World Finance Magazine 颁赠
World Finance Forex Awards 2019 -
荣获 World Finance Forex Awards 2018 颁赠
-
荣获2018年埃及金融博览会颁赠
-
荣获 Shares Magazine 的 UK Forex Awards 2017 颁赠
-
荣获 World Finance Forex Awards 2017
-
2016年最佳黄金经纪商
-
2016年最佳外汇经纪商
-
2015年最佳本地客户服务
-
Global Brands Magazine 颁赠
-
Online Money Awards 2022 颁发
-
荣获2022年埃及金融博览会颁赠
-
2015最佳外汇交易平台
-
2015最佳金融交易平台
-
2013最佳创新外汇平台奖
-
2020年 Cyprus HR Awards 颁赠
-
金融行业的佼佼者
-
认证最优金牌级别
-
2014年首届亚军

Awarded BestBrokerYear After Year
CATEGORIES
News
- Interest rate cut expectations continue to rise, and the U.S. dollar index is un
- Traders wait for PPI data and the Fed's stance, the U.S. dollar index pulls back
- A lose-lose game, the shutdown is a theater rather than a policy tool
- The game between the Ministry of Finance and the central bank has entered a crit
- Li Ning announced its participation in Meituan’s flash sale, and its stock price
market analysis
The long-legged cross is about to break, and the gold and silver range is much lower
Wonderful introduction:
One person’s happiness may be fake, but the happiness of a group of people can no longer distinguish between true and false. They squandered their youth to their heart's content, wishing they could burn it all away. Their posture was like a carnival before the end of the world.
Hello everyone, today XM Forex will bring you "[XM Forex Platform]: Long-legged cross waiting to break, gold and silver range is low and long". Hope this helps you! The original content is as follows:

Yesterday, the gold market consolidated its range. After opening at 4492.7 in early trading, the market first fell back. The daily low reached 4418.8, and then the market fluctuated strongly and rose. The daily high was After touching the position of 4581.2, the market fell back under pressure. After the daily line finally closed at the position of 4510.7, the daily line closed in the form of a cross star with the lower shadow line slightly longer than the upper shadow line. After such a form ended, , today's market will still be higher after the market retreats. In terms of points, last week's long stop loss of 4120 was followed at 4200, and the stop loss of 4310 long reduction was followed at 4395. If today's market falls first, the stop loss is more than 4470. 4464, the target is 4510 and 4535, 4560 and 4582. If the position is broken, look at the 4600-4603 pressure range. If the position is broken, the upper space will be opened to see the pressure of 4660 and 4700.
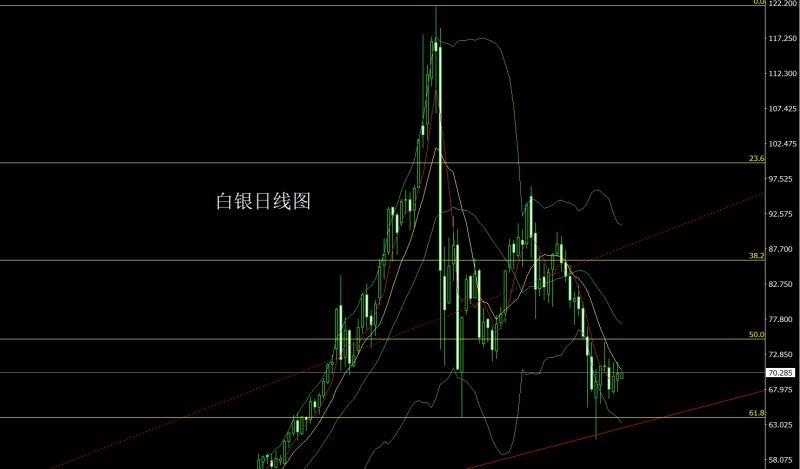
The silver market first fell back after opening at 69.235 yesterday. The daily minimum reached 67.615 and then the market rose strongly. The daily maximum touched 71.775 and then the market consolidated under pressure. The daily maximum After finally closing at 70.1, the market closed in the shape of a spindle with upper and lower shadow lines of equal length. After finishing in this form, today's market is 67.7 with a stop loss of 67.5, and the target is 68.5, 69, and 70-71.

European and American markets fell to a low of 1.14997 yesterday, then the market fell back to a position of 1.14866 and then rose strongly. The highest daily line touched a position of 1.15210 and then fell back under pressure. The lowest daily line reached a position of 1.14424 and then consolidated. The daily line finally closed at a position of 1.14618. The line is a large negative line with the same length as the upper and lower shadow lines. After this form ends, today's market price is 1.15000. Short stop loss is 1.15200. The target is 1.14600 and 1.14400. If it falls below, look at 1.14200 and 1.14000. If it breaks, look at 1.13800 and 1.13600.
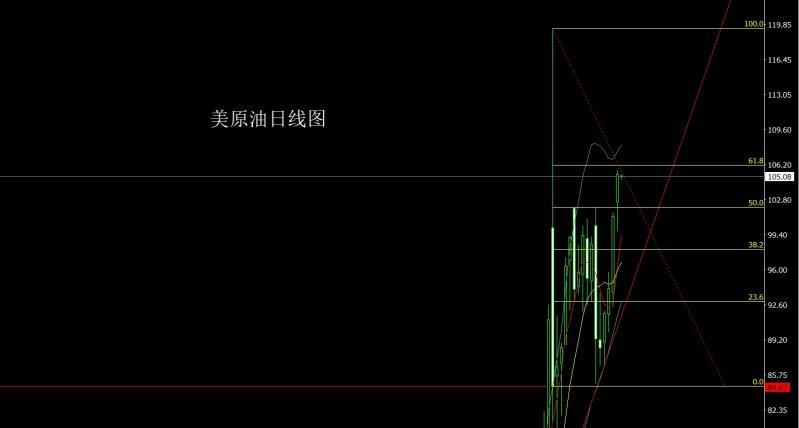
The U.S. crude oil market opened higher yesterday at 102.59 and then the market fell back first. The daily line reached the lowest position of 99.73 and then the market rose strongly. The daily line reached the highest position of 105.67 and then consolidated. The daily line finally closed at 105.26 and the daily line ended with a very long lower shadow. The big Yang line closes, and this form closes, and after this form ends, today's market will still be high. In terms of points, after yesterday's long reduction of 100.15, the stop loss was followed up at 101, and today's market is 103.5, and the stop loss is 103. The target is 105, 106, and 107-108.
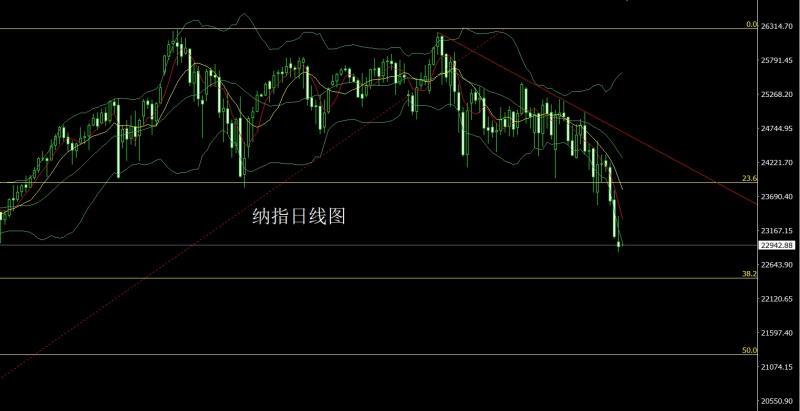
Yesterday, the Nasdaq opened low at 22986.8 in early trading and then the market first rose. The daily high hit the 23391.8 position and then the market fell back under pressure. The daily low reached the 22833.3 position and then consolidated. After the daily line finally closed at 22915.53, the daily line closed at 22915.53. The inverted hammer pattern with a very long upper shadow line closed. After the end of this form, today's market continues to be bearish. In terms of points, yesterday's short position at 23350 was followed by a stop loss of 23300. Today's market price is 23200 and a short stop loss is 23260. The target is 22900 and 22800. If it falls below, 22700, 22600 and 2 2500.
Fundamentals, yesterday's fundamentals speech: The Fed Chairman stated that the central bank is inclined to keep interest rates unchanged and adopt a "penetrating observation" attitude towards the energy shock caused by the Iran war, but at the same time warned that if rising prices begin to change the public's long-term expectations for inflation, the Fed may not be able to continue its policy. The dilemma facing the Fed is that energy shocks often have a dual effect: on the one hand, they push up prices, and on the other hand, they drag down economic growth by xmaccount.compressing household budgets and raising business costs. This makes policymakers have to weigh whether to prioritize curbing inflation or supporting the economy, and at the same time, they are clearly aware of the need to solve one of these problems.of standard tools, often exacerbating another problem. Powell appeared extremely cautious about how the Fed would answer this difficult question. He said: "We may eventually face the question of how to respond, but we haven't really reached that point yet, because we don't yet know how these economic impacts will manifest." The still hawkish remarks have supported the U.S. index and put pressure on non-U.S. stocks. The U.S.'s continued trend of adding troops to Iran means that the U.S.-Israeli war is developing on a larger scale. Crude oil prices have been pushed up. Today's fundamentals focus on the initial annual CPI rate of the Eurozone in March at 17:00. In the evening, look at the monthly rate of the FHFA house price index in the United States at 21:00 in January and the annual rate of the S&P/CS non-seasonally adjusted house price index in 20 major cities in the United States in January. Later, look at the US March Chicago PMI at 21:45, the US February JOLTs job vacancies at 22:00 and the US March Conference Board Consumer Confidence Index.
In terms of operation, gold: Last week’s long stop loss of 4120 was followed up at 4200, and after the long reduction of 4310, the stop loss was followed up at 4395. If today’s market falls back to 4470 first, the stop loss is 44 64. The targets are 4510 and 4535, 4560 and 4582. If the position is broken, the pressure range is 4600-4603. If the position is broken, the upper space is opened to see the pressure of 4660 and 4700.
Silver: Today’s market price is 67.7, long stop loss is 67.5, target is 68.5, 69 and 70-71.
Europe and America: Today’s market price is 1.15000, short stop loss is 1.15200 target 1.14600 and 1.14400. If it falls below, look at 1.14200 and 1.14000. If it breaks, look at 1.13800 and 1.13600.
U.S. crude oil: Reduce long positions at 100.15 yesterday The stop loss is followed up at 101. Today's market is 103.5 and the stop loss is 103. The target is 105, 106 and 107-108.
Nasdaq: After yesterday's short position reduction of 23350, the stop loss is followed up at 23300. Today's market price is 23200, short stop loss is 23260, target is 22900 and 22800, if it falls below, 22700, 22600 and 22500 will be seen.
4560 was short last night

The above content is all about "[XM Foreign Exchange Platform]: Long-legged cross waiting to break, gold and silver range is low and much lower". It is carefully xmaccount.compiled and edited by the editor of XM Foreign Exchange. I hope it will be helpful to your trading! Thanks for the support!
Only the strong know how to fight; the weak are not even qualified to fail, but are born to be conquered. Hurry up and study the next content!
Disclaimers: XM Group only provides execution services and access permissions for online trading platforms, and allows individuals to view and/or use the website or the content provided on the website, but has no intention of making any changes or extensions, nor will it change or extend its services and access permissions. All access and usage permissions will be subject to the following terms and conditions: (i) Terms and conditions; (ii) Risk warning; And (iii) a complete disclaimer. Please note that all information provided on the website is for general informational purposes only. In addition, the content of all XM online trading platforms does not constitute, and cannot be used for any unauthorized financial market trading invitations and/or invitations. Financial market transactions pose significant risks to your investment capital.
All materials published on online trading platforms are only intended for educational/informational purposes and do not include or should be considered for financial, investment tax, or trading related consulting and advice, or transaction price records, or any financial product or non invitation related trading offers or invitations.
All content provided by XM and third-party suppliers on this website, including opinions, news, research, analysis, prices, other information, and third-party website links, remains unchanged and is provided as general market commentary rather than investment advice. All materials published on online trading platforms are only for educational/informational purposes and do not include or should be considered as applicable to financial, investment tax, or trading related advice and recommendations, or transaction price records, or any financial product or non invitation related financial offers or invitations. Please ensure that you have read and fully understood the information on XM's non independent investment research tips and risk warnings. For more details, please click here